Oracle BI EE 10.1.3.3/2 – SA System Subject Area – Autoloading Profiles And Bursting


Those users who have worked with Siebel Analytics 7.7 or above, they would be aware of a special subject area called SA System subject area that was necessary to set up Delivers. But with the advent of new releases(10.1.3.3 and above), SA System subject area is not mandatory any more. But still SA System Subject area can be very useful in a lot of scenarios. One of the major uses of this special subject area is that, by setting this up one can automatically populate the Delivery Profiles of all the users. If this is not setup, one would have to manually go into My Account section of each and every user and then set it up. For example, a typical use case is, you would be having the list of users and their corresponding email ids in an excel file. You do not want the users to manually go and enter their email ids. In such a case, just setup the SA System subject area, then all the users would automatically get their email ids, phone, pagers etc automatically assigned to their profiles. Today, we shall see how to go about setting this subject area. Lets start with a simple table script that would help us to store all the Users, their corresponding Groups and also their email ids, pager and phones. Remember, SA System subject expects you to specify all the shown columns below.
  1. CREATE TABLE SA_SYSTEM  
  2. (  
  3. EMAIL VARCHAR2(100),  
  4. EMAIL_PRIORITY VARCHAR2(10) DEFAULT ’HNL’,  
  5. EMAIL_TYPE VARCHAR2(50) DEFAULT ’html’,  
  6. CELL_PHONE VARCHAR2(40),  
  7. CELL_PHONE_PRIORITY VARCHAR2(20),  
  8. PAGER VARCHAR2(20),  
  9. PAGER_PRIORITY VARCHAR2(30),  
  10. HANDHELD VARCHAR2(20),  
  11. HANDHELD_PRIORITY VARCHAR2(30),  
  12. TIMEZONE VARCHAR2(100),  
  13. GROUP_NAME VARCHAR2(20),  
  14. LOGON VARCHAR2(50) NOT NULL,  
  15. DISPLAY_NAME VARCHAR2(100),  
  16. LOCALE VARCHAR2(20) DEFAULT ’en’,  
  17. LANGUAGE VARCHAR2(20) DEFAULT ’en’  
  18. )  
CREATE TABLE SA_SYSTEM
(
EMAIL VARCHAR2(100),
EMAIL_PRIORITY VARCHAR2(10) DEFAULT 'HNL',
EMAIL_TYPE VARCHAR2(50) DEFAULT 'html',
CELL_PHONE VARCHAR2(40),
CELL_PHONE_PRIORITY VARCHAR2(20),
PAGER VARCHAR2(20),
PAGER_PRIORITY VARCHAR2(30),
HANDHELD VARCHAR2(20),
HANDHELD_PRIORITY VARCHAR2(30),
TIMEZONE VARCHAR2(100),
GROUP_NAME VARCHAR2(20),
LOGON VARCHAR2(50) NOT NULL,
DISPLAY_NAME VARCHAR2(100),
LOCALE VARCHAR2(20) DEFAULT 'en',
LANGUAGE VARCHAR2(20) DEFAULT 'en'
)
     
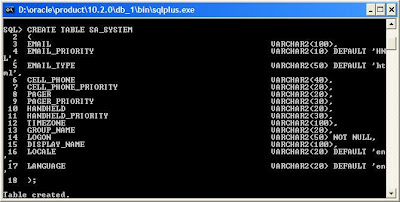
Assume that we have 2 users <b>Administrator and Sample</b> in our repository. So, lets enter all their relevant details into the above table.
  1. INSERT INTO SA_SYSTEM(EMAIL, GROUP_NAME, LOGON, DISPLAY_NAME) VALUES (<a href=”mailto:’venkatakrishnan.janakiraman@oracle.com’,'Administrators’,'Administrator’,'Administrator’“>’venkatakrishnan.janakiraman@oracle.com’,'Administrators’,'Administrator’,'Administrator’</a>);  
  2. INSERT INTO SA_SYSTEM(EMAIL, GROUP_NAME, LOGON, DISPLAY_NAME) VALUES (<a href=”mailto:’krisvenky83@gmail.com’,'Administrators’,'Sample’,'Sample’“>’krisvenky83@gmail.com’,'Administrators’,'Sample’,'Sample’</a>);  
  3. COMMIT;  
INSERT INTO SA_SYSTEM(EMAIL, GROUP_NAME, LOGON, DISPLAY_NAME) VALUES (<a href="mailto:'venkatakrishnan.janakiraman@oracle.com','Administrators','Administrator','Administrator'">'venkatakrishnan.janakiraman@oracle.com','Administrators','Administrator','Administrator'</a>);
INSERT INTO SA_SYSTEM(EMAIL, GROUP_NAME, LOGON, DISPLAY_NAME) VALUES (<a href="mailto:'krisvenky83@gmail.com','Administrators','Sample','Sample'">'krisvenky83@gmail.com','Administrators','Sample','Sample'</a>);
COMMIT;
Lets look at what each of the above columns do
EMAIL – Stores the email addresses of the user.
EMAIL_PRIORITY – Can take 3 values. ‘H’ for High, ‘N’ for Normal, ‘L’ for low. ‘HNL’ means High, Low and Normal. You can use these in any combination.
EMAIL_TYPE – Can take ‘html’ or ‘text’. This primarily tells whether the email client supports html or only text.
CELL_PHONE – Cell phone details
CELL_PHONE_PRIORITY – Same as EMAIL_PRIORITY
PAGER – Pager details
PAGER_PRIORITY – Same as EMAIL_PRIORITY
HANDHELD – Handheld details
HANDHELD_PRIORITY – Same as EMAIL_PRIORITY
TIMEZONE – This can be Null. Basically tells the timezone of the user.
GROUP_NAME – The actual GROUPs to which the Logon user belongs.
LOGON – User Login Name
DISPLAY_NAME – User Display Name
LOCALE – Default it to ‘en. It specifies the user Locale.
LANGUAGE – Default it to ‘en’. It specifies the user Language.
Now, import the above created table into the repository and design your BM and Presentation Layers. You should rename the Presentation Layer columns to the one shown below.
Cell Phone
Cell Phone Priority
Display Name
Email
Email Priority
Email Type
Group Name
Handheld
Handheld Priority
Language
Locale
Logon
Pager
Pager Priority
Time Zone
If you use any other names, SA System subject area would not work.
     
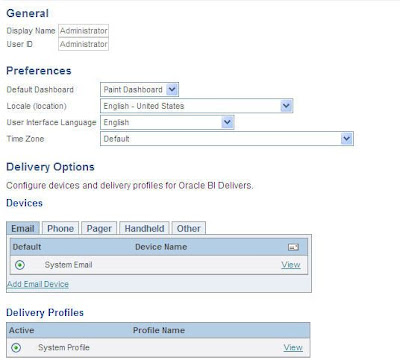
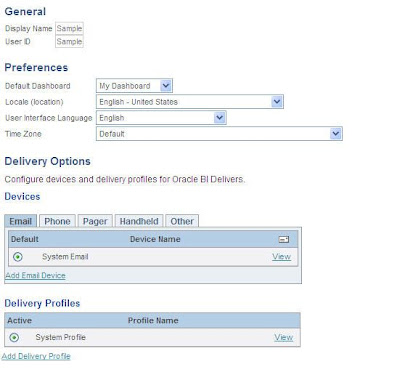
Once this is done restart the presentation services. Now login as Administrator and go to Settings -> My Account. You would notice that the delivery profile would automatically be populated and also the email id would also have been associated to the profile. Same would be the case for the Sample user.
     
     
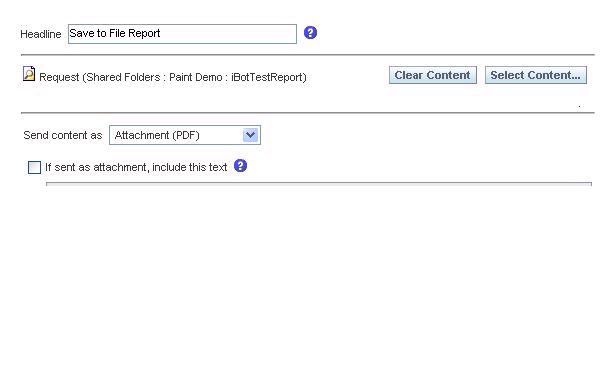
Sometimes this can be very useful. But always remember, if any user goes and modifies their delivery profile, that would take precedence over the SA System Subject area.. One other advantage of using this SA system subject area is that you can use this to do email bursting of reports. For example, in most cases, not every user would have the delivery profile created. In such a case, just load up the SA System subject area and then assign the email ids to the users. Just create a simple report on the SA System subject area to have a display on the LOGON names.
     
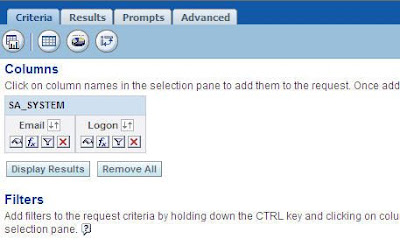
Use this in the conditional request and pass the LOGON field to the list of recipients.
     
This would automatically do the bursting to all the users. This would be very handy while doing mass email deliveries

Troubleshooting MSOffice Plug-In With OBIEE In 10.1.3.3


Generating Log files
The procedure to generate client log is as follows:
Client log:
1. Open Excel/PPT and go to About Oracle BI from the Oracle BI Menu
2. Press Ctrl + L
3. A dialog will appear to enable logging
4. Select all levels to be logged, close this dialog
5. Now try to login and set the error message
6. From windows explorer, go to folder where you installed the add-in, typically it is
“c:\program files\Oracle\BiOfficeExcel” or “c:\program files\Oracle\BiOfficePowerPoint” depending on whether if you are running Excel or PowerPoint respectively.
7. In the Log folder under the above, zip the log files generated.

 
Server log:
To enable server log, open the server config file at the installed bioffice application dir:
WEB-INF\bioffice.xml

 
Change the LogLevel property to 5 (debug):
    <!– LogLevel Never = 1; Error = 2; Warning = 3; Msg = 4; Debug = 5; –>
    <property name=”LogLevel” type=”int”>5</property>

 
 Then go back to Office Excel Client, try connecting to Office Server again. The server log file location is:
WEB-INF\log\bioffice_[Today's Date].log

How To Bypass Server Cache For A Specific Report On Dashboard Or Dashboard Prompts


We have requirement for a specific report not hitting cache and data in the report should come directly from database tables.
Use the following syntax for the query
SET VARIABLE DISABLE_CACHE_HIT=1;SELECT “Paint”.”Year” FROM Paint order by “Paint”.”Year” ASC
SET VARIABLE syntax can be directly coded into Dashboard prompt as SQL.
For a specific report it can be included in the Advanced section under Prefix.

Using Variables In Title View With Default Values

Here’s an example title. It contains two presentation variables with their
default values. The query uses the two presentation variables with a between
operator.
Sales and Inventory Trends from @{StartDate}{4/5/2008} to
@{EndDate}{4/19/2008}

Writing IBots Results To A File


Script to save iBot results to a file
—————
var FSO = new ActiveXObject(“Scripting.FileSystemObject”);
var foldername = GetConfigurationValue(“Log Dir”, “iBots”) + “\\” + UserID
if (FSO.FolderExists(foldername))
{
var fileName = foldername + “\\” + JobID + “-” + InstanceID + “-” + Parameter(1);
var fooFile = FSO.CopyFile(Parameter(0), fileName, true);
}
else
{
FSO.CreateFolder(foldername);
var fileName = foldername + “\\” + JobID + “-” + InstanceID + “-” + Parameter(1);
var fooFile = FSO.CopyFile(Parameter(0), fileName, true);
}
—————-
Note in the above I have paramterized so all the content for different users will go to the folder with their name. If folder does not exist then it will create it first time.
To setup the iBot you need to do is change the Delivey content as Attachment
Then in the Script just pass in the File name.
It send the Results of the iBot to PDF or whichever download format you use.
Default is 250 lines, but you can extend that to whatever number you want. By Default if you choose csv file then it will be all the data, no limit.
 

Refreshing Data From Source Tables In DAC


--update refresh dates to re-fresh data for these
tables
update w_etl_table_dt tbl_dt
set last_refresh_dt = null
where exists 
(select 'x' from w_etl_table tbl, w_etl_dbconn dbconn
where tbl_dt.table_wid = tbl.row_wid
and dbconn.row_wid = tbl_dt.dbconn_wid
and dbconn.name = 'OLTP'
and tbl.name in ('S_DOC_AGREE','S_AGREE_ITEM'));
 
In this in place of in ('S_DOC_AGREE','S_AGREE_ITEM')
you should change and do it for all the S_ tables.
Also instead of set last_refresh_dt = null set set
last_refresh_dt = <2 year ago>.
 
 You can then see the SQL in Change capture phase to
check if this is really working. 

In Between Calendar Control with Sliding dates


I would like to share how I use to implement sliding days and dynamic date range with in reports.

Problem: Many times we come across requirement to have recent orders or activities etc. Here recent may be 1 day or 1 week or 1 month depends on different users.

Solution: To accommodate all above, I will pull report with latest 7 days i.e
Between CURRENT_DATE-7 and CURRENT_DATE and also I will give controls to user to choose between dates from page prompt so that user can get what they need.

Example: Today(July 24) report will pull recent 7 days as default(July 17 to July 24) and if I access same report tomorrow , report will pull July 18 to July 25 data as default. Same time user provided with page prompt control to choose dates. (Exp. July 17 to July 30).
Here are step by step to do that.
At first we need to have dynamic variables so create Server Variable’s for your requirement in my case startDate_ServerVariable with week ago date (SYSDATE - 7) and endDate_ServerVariable as Current date (SYSDATE).
1. To do that, in RPD navigate to repository – initialization block
2. Create new initialization block
3. Edit Data Source
4. Select Data Source Type as Database
5. Edit default initialization string with “select sysdate, sysdate-7 from dual”
6. Assign Connection Pool and also choose refresh rate of these variables.
7. Click on test to see proper values populated and say okay
8. Now click on Edit Data Target button
9. Create server variables
10. Click okay; close Variable Manager, Save RPD.


Now create prompts with Date-Calendar control and assign default value with server variable and also create new presentation variables as shown below.
Create report with filter on date column using between syntax will be like,
DateColumn is between @{startDate_PVariable}{1900-01-01 12:00:00} and @{endDate_PVariable}{1900-01-01 12:00:00}

For more detailed information follow these articles.
Venkat posted very good article on between, John has posted very good solution on Calendar Control.

Possible error:
If you have not specified proper default values for presenation variables exp "Date”.CreatedDate" is between @{startDate_PVariable} and @{endDate_PVariable} then you will end up with following error.
Error getting drill information: SELECT "Date”.CreatedDate" saw_0 FROM subjectarea WHERE "Date”.CreatedDate" BETWEEN date '0000-00-00' AND date '0000-00-00'
State: HY000. Code: 10058. [NQODBC] [SQL_STATE: HY000] [nQSError: 10058] A general error has occurred. [nQSError: 46048] Datetime Month value 0 from 0000-00-00 is out of range. (HY000)

Make sure proper default value has provided for presentation variable.

--Next post on how to manage/switch between multiple environments on single machine

Merry Christmas


I wish you a Merry Christmas

Have a safe and happy holidays,

How to Get UserID and Password

On OTN this question asked. Question is how to get current UserID and Password on a Report, to address this here I'm posting this blog so that it will be help full to other people as well.
In Reporting we can get userid by using function 'USER()' but there is no flexibility on how to get password

To get password we need to do little trick as shown below.
Create new session initialization block with sql query as
select ':USER',':PASSWORD' from dual
And assign these values to session variables, example GetUser, GetPassword
access these session variables on report by VALUEOF(NQ_SESSION.GetUser) or VALUEOF(NQ_SESSION.GetPassword) respectively.


How to find current value of each Server Variables?


If you want to know current assigned values of server variables with in your BI Server then follow these steps.
1. Open RPD
2. Goto Manage menu tab
3. From manage menu select “Sessions …”
From O.B.I.E.E
4. Pops up Session Manager
5. From available sessions choose a session
6. Now click on variables tab, it will show all server and session variables and respective values at that particular time.
From O.B.I.E.E
In general following type of variables you can see here

Session System: all these variables have specific purpose (reserved key words) with in BI system
Exp: USER, DISPLAYNAME, EMAIL, LOGLEVEL, GROUP, LAST_SYNCH_TIME, PORTALPATH, REQUESTKEY, SKIN, WEBGROUPS, PASSWORD

Session Non-System: These variables are created by admin, for various reporting purposes.
Exp: USERROLE, USERGEO, USERCURRENCY etc

Session System and Session Non-System variables are specific to user logged on.

Dynamic Repository Variables:
These variables can be used by any users with in BI system created by admin,
Exp: LASTWEEK, LASTMONTH, YESTARDAY, CURRENTYEAR etc

Static Repository Variables:
These are initialized when BI Server start remain same as long as server runs.
Exp: PATH_TO_RESOURCE_FILES, WELCOME_MESSAGE, etc.

For more information on variables and how to create variables look at here

Best practice: Optimally define dynamic repository variables.

Leading or Trail Space Trim Issue


If you have column-values with leading or trail spaces those space will be trimmed by presentation services by default, if you drilldown to detail, will lead to no-results or wrong records.

Suppose in your column only these values are there ‘abc’, ‘abc ’ (spaced value),’xyz ’ (spaced value) if you drill on ‘abc’ you will get proper records of 'abc', if we drill on ‘ abc’ will display ‘abc’ records but not ‘ abc’ records, if we drill on ‘xyz ‘ then it will say no results.

To avoid these problems, change column’s data format property to “Plain text (don’t break spaces)” by this property presentation services will not trim leading or trail spaces.
Even in OTN once or twice asked this questionJohn and Stijn have suggested very good solutions.
I have faced same issue today, I cannot apply my logic because column selected from column selector, so went with Stijn's recommendation.

How to embed My Account link on dashboard page


One of question asked in BI Forum about how to move "My Accounts" link into "My Dashboard"
Here you can see half of solution i.e My Account embedding on to shared dashboard instead of My Dashboard.


To do that

Step 1: Go to C:\OracleBI\web\app folder
Step 2 Create a new file userPref.txt or what ever name you want.
Step 3 Place following code in this file userPref.txt then save the file.
< % @LANGUAGE="JScript" % >
< % Response.Redirect("saw.dll?UserPreferences"); % >(with out spaces between < % or % >)
Step 4 Rename the userPref.txt to userPref.asp (file extension type must be as .asp)
Step 5 Now Create a new dashboard page.
Step 6 Drag and drop Embedded Content object on this new page.
Step 7 Modify Embedded Content’s properties.
Step 8 In URL edit box place this url http://localhost/analytics/userPref.asp
Step 9 save the page.

Same way we can embed sessions, perfmon , Administration on Dashboard.

Quickly find out which presenation columns are used in which report


There is no easy way to find out which presentation columns are used in which reports and dashboards. I have come across a situation where we need to quickly identify presentation columns used in each report. I didn’t have enough time to go thru all reports.

To save time, I have created a tool which will output the below information.

Report path and name
Dashboard page name
Presentation column subject area name
All the Filters in the report
All the presentation column names (comma separated)

How to use this tool?

2 Launch cmd
3 In cmd pass parameters as following sequence database SID, Usage track schema user name, password.
Example:
C:\location_of_tool\ReportAnalysisConsoleApplication.exe oracle_database_SID usagetrack_USERID usagetrack_PWD > C:\output_directory_or_what_ever\AnalyzedDataOutput.txt

Prerequisites:
Report should access at least once after usage track enabled.

Conditional Formatting in Grand Total in Pivot Table View


ust now saw a post in OTN on Conditional Formatting in Grand Total - Pivot Table View, here is a possible work around for this.

Sample Exp
Region price per unit
south 89
north 86
west 92
east 99
Grand total 91.5

Conditional format is if 90% above is green other wise red this works well on individual cells but not in default grand total option.
Possible solution is, create a report with required columns and apply required conditional formats on columns. Create pivot view, locate column choose more options, on click menu choose “new calculated item …” select function as AVG and select all available columns, give a name Grand Total or what ever may be say ok.
Now you can able to see conditional format on custom row "Grand Total Row".

Here are steps to do that(Paint Example)

From O.B.I.E.E


Thinking on..., are there any other easy solutions :)

Display Data Base Images on report


Inspired by one of post in OTN forum on how to populate data base images on a native report, here assumptions are database having image URL, images are residing in image resource folder.
To do that first keep all images files in OracleBI\web\app\res\s_oracle10\images i.e fmap:images\xyz.jpg
Keep all image file names (with file extn) in database as required.

Exp: Suppose geo dimension with
South as south.jpg
West as west.jpg
East as east.jpg,
North as north.jpg

To display images on report:

Add image’s column to report
(Just to illustrate example I have added image file names in ERROR_TEXT in Usage track Schema.)
Click on Column Properties, go to Data Format tab

Check “Override Default Data Format” and from drop down choose “Custom Text Format”
In Custom Text Format edit box place following script.
@[html]" < !-- img src="\\analytics\\res\\s_oracle10\\images\\""@H""" -- > "(Please uncomment html tags)

Browse report, images url's will be fetched from database appended with resource file displayed on report.

Here is a good example on how to embed image on a web page with various options.

nQSError: 61013 Can not save changes to the repository


If you come across following error don’t be panic.
warning: can not save changes to the repository because,
[nQSError: 61013] File error: path= C:\OracleBI\server\Repository\paint.rpd , code=31: There has been a sharing violation.
May be its because of, you have started working on repository (offline mode) then started BI Server, after server services start, if you try to save repository you will see above message.

If you want to save all your changes just stop BI Services, and then save repository it will save all changes made to repository.

Information on Request XML


Information on Request XML

Today i would like to give some information on Report XML.
Every request internally stored as xml. i.e Request XML, you can view request xml in two ways, goto request’s advanced tab, under Request XML segment you can view this xml or Using Catalog Manager – locate report— on report right click – choose properties –click on Edit XML button—pops window with xml.
Here is through catalog manager.
In general creating a new request throughUI consists of criteria, results, prompts same thing with xml file, it compromise of three main divisions criteria, views, prompts under root node report.
Every request consists of common xml namespace (identified with uniquely named elements and attributes) attributes i.e xmlns
Then next part is criteria (report — criteria)
Criteria element again divided into two major elements Columns, Filters same as UI web construction.
Here is an example with namespaces and all available columns in report.
If you expand column, it internally composed from column related elements and attributes, here is a sample.
Then second large part in criteria is Filters, as show like below
Then next part in report is Views (report –views), in this section consists of all available views for corresponding report.
Last section in report is prompts, here all propmpt related things will be defined in xml, like caption, on which column, control etc
Following chart consist of some of basic elements or attributes and why they are used.
Element
Possible Attributes/Child Elements
Description
saw:report
Is a root element
saw:report
xmlns:saw="com.siebel.analytics.web/report/v1" xmlns:xsd="http://www.w3.org/2001/XMLSchema" xmlns:xsi="http://www.w3.org/2001/XMLSchema-instance" xmlns:sawx="com.siebel.analytics.web/expression/v1"
Possible namespace
saw:report
xmlVersion="200705140"
Version of xml
saw:criteria
It’s a saw:report child node.
Consist of all columns and filter related stuff in this section
saw:criteria
subjectArea="Paint"
Defines subject area
saw:criteria
saw:columns
Consist of all report related columns
saw:columns
saw:column
To define column related properties
saw:column
Formula
Defines which column it refer to in presentation layer
saw:column
ColumnID
To identify uniquely across referring report
saw:column
saw:displayFormat exp:
To display cell display properties
saw:column
saw:dataFormat
To display column display properties
saw:column
saw:condition
Exp:
sawx:expr xsi:type="sawx:comparison" op="equal">
ALBANY
To display conditional display
saw:column
saw:navigation
To control drill downs or navigation to other reports
saw:navigation
saw:navTarget
To define navigation target and path
saw:navTargets
Caption
To display Caption
saw:column
saw:columnHeading
exp:
Market
To define header name
saw:filter
subjectArea
To define referring subject area
saw:filter
sawx:expr
To define expression type
Possible expression categories
sawx:expr
xsi:type
To define logical conditions types
Comparison
sqlExpression
savedFilter
string etc.
sawx:expr
op
Operator
saw:views
Is child node of report sibling of criteria element used to customize report layout formats i.e. pivot,table,static view etc
saw:views
currentView
Is one among several display layouts
saw:views
saw:view
To displayor customize particular view
saw:view
xsi:type
To define which view we needed
Here all possible views
saw:titleView
saw:tableView
saw:staticchart
saw:pivotTableView
saw:filtersView
saw:htmlview
saw:narrativeView
saw:sqlview
saw:segmentview
saw:targetlistview
saw:colFilterPrompt
saw:view
saw:cvTable
Compound layout can consist many views ..they are defined as table
saw:cvTable
saw:cvRow
Each view as row
saw:view
autoPreview="true"
Decides whether to display automatically results or not when we access view
saw:prompts
Is a sibling of criteria, view elements or child of report element
Which is used to define prompts
saw:prompts
xsi:type="saw:colFilterPrompt"
To define type of prompt
saw:prompts
Formula
To define presentation column
saw:prompts
subjectArea
To define which subject area
saw:prompts
Op
Operator
saw:prompts
controlType
To set control exp dropdown or edit box or multi selector
saw:prompts
saw:promptCaption
To set caption of prompt

There are few more advanced option which have not mentioned in above chart.

If you have any problem in viewing description in above chart, please find doc file here.

If you need my refernced Request XML file composed on top of paint, then please find here.