Oracle BI EE 10.1.3.3/2 – Calling Java Scripts and Java Classes from iBots

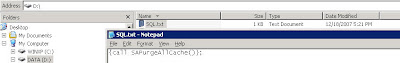
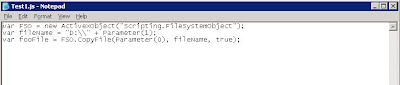
One of the very good features of BI EE is its ability to call custom Java Scripts and Java Classes after the execution of iBots. Lets look at some examples today. In the first example we shall see how to save the reports scheduled via ibots to a local directory using a simple Java Script. It is assumed that you have your scheduler up and running. The first step in this process is to create a simple Java Script like the one below. I have taken this directly from the docs for demonstration purposes. You can customize this to your needs.
var FSO = new ActiveXObject(“Scripting.FileSystemObject”);
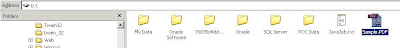
var fileName = “D:\\” + Parameter(1);
var fooFile = FSO.CopyFile(Parameter(0), fileName, true);
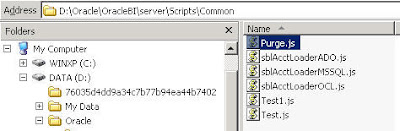
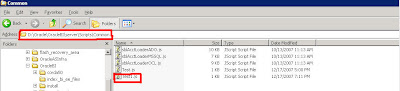
As you see above what this Java Script basically does is that it accepts one parameter (Parameter(1)) which is the file name and saves this file to a desired location that is in D drive. You need to save this file under {OracleBI}\server\Scripts\Common folder.
      
      
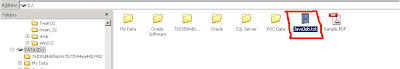
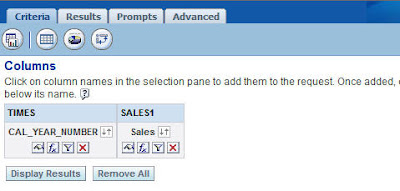
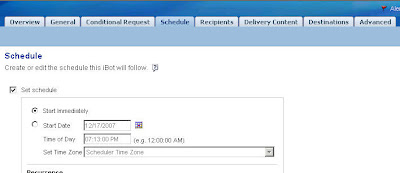
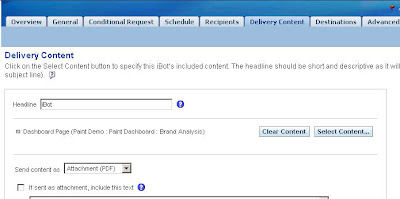
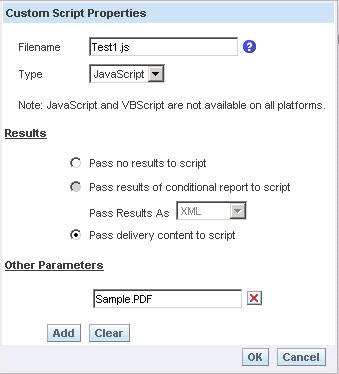
Once this is done, the next step is to call these scripts in your ibots. For example, lets choose a dashboard for content, PDF for attachment and schedule it to run immediately. In the Advanced of this ibot, choose the Java Script that you had created earlier. Remember you need to pass the file name (in my case it is sample.pdf) for Parameter(1) as a parameter.


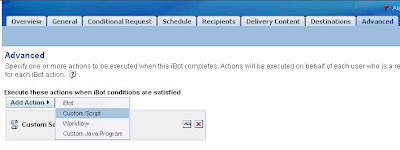
The above was pretty straight forward. All we needed to do was to put the custom Java Script in a designated folder and call that in the Advanced tab of an ibot. Now lets look at calling a Java Class from an Ibot. There are certain things that we need to understand before we proceed further. Oracle Delivers uses the Java Host Service to make calls to a Java Procedure. So, if you go to {OracleBI}\web\javahost you would find a directory called Scheduler. Under this directory you would find a jar file called schedulerrpccalls.jar. This is the scheduler jar file that we can use to directly obtain the scheduler objects like the iBot attachments, the instance, job ids etc. So, our aim is to call a Java Program after the execution of an iBot is to write the details of the iBot schedule to a text file. In this example, i shall be using JDeveloper. Lets look at the steps one by one.
1.   Open the Config.xml file under {OracleBI}\web\javahost\config in a text editor. Search for the Scheduler tag and change it as shown below.
<Scheduler>
 <Enabled>True</Enabled> <DefaultUserJarFilePath>D:\Oracle\OracleBI\web\javahost\lib</DefaultUserJarFilePath>
</Scheduler>
The reason why we are changing the above tags is to make Java Host aware of the Java Classes that scheduler would be calling. And the DefaultUserJarFilePath tag points to the directory where we would be placing our Jar file( custom jar file using our custom Java Class). After changing this restart the Java Host Service.
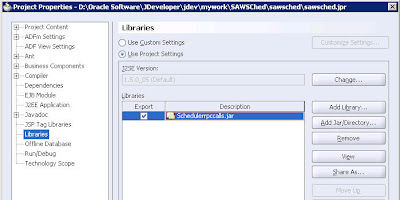
2.   Open JDeveloper and create a simple Application, Project with a simple Java Class. In my case i have created a simple Application called SAWSched which in turn has an application called sawsched. The final class file that i created under this project is called as sawsched.java.
3.   In this custom java file lets include the following code. Ensure that you are including the schedulerrpccalls.jar in your Project Properties.
      
package sawsched;import java.io.*;
import java.lang.Thread;
import com.siebel.analytics.scheduler.javahostrpccalls.SchedulerJavaExtension;
import com.siebel.analytics.scheduler.javahostrpccalls.SchedulerJobException;
import com.siebel.analytics.scheduler.javahostrpccalls.SchedulerJobInfo;
public class sawsched implements SchedulerJavaExtension{
public void run(SchedulerJobInfo jobInfo) throws SchedulerJobException
{
System.out.println(“JobID is:” + jobInfo.jobID());
System.out.println(“Instance ID is:” + jobInfo.instanceID());
System.out.println(“JobInfo to string is:” + jobInfo.toString());
try
{
File outputFile = new File(“D:\\JavaJob.txt”);
File attachFile = jobInfo.getResultSetFile();
attachFile.createNewFile();
FileWriter out = new FileWriter(outputFile);
out.write(“User ID:\t\t” + jobInfo.userID() + “\r\n”);
out.write(“Job ID:\t\t” + jobInfo.jobID() + “\r\n”);
out.write(“Instance ID:\t\t” + jobInfo.instanceID() + “\r\n”);
out.write(“Parameter Count:\t\t” + jobInfo.parameterCount() + “\r\n”);
out.write(“File Path: ” + attachFile.getAbsolutePath());
for(int i = 0; i < jobInfo.parameterCount(); ++i)
{
out.write(“\tParameter “);
out.write(new Integer(i).toString());
out.write(“:\t” + jobInfo.parameter(i) + “\r\n”);
}
out.close();
}
catch(Exception ex)
{
throw new SchedulerJobException(1, 1, ex.getMessage());
}
}
public void cancel()
{
}
}
      
What this class basically does is it creates a text file which would have details about the iBot job. The above example is available in the bookshelf.
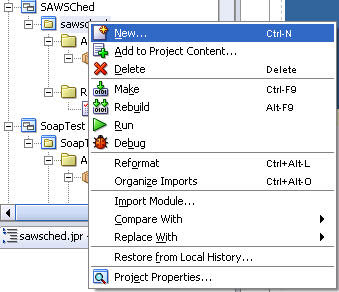
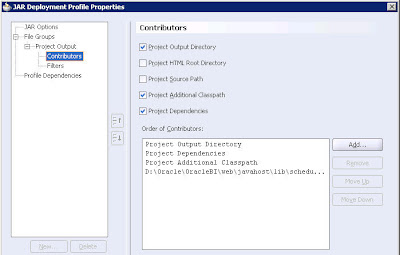
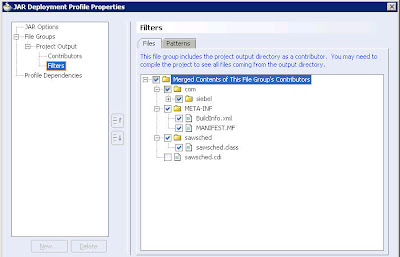
4.   Once this is done compile this code to ensure that you have no errors. The next step is to create a JAR file out of this class. So, right click on your Project and create a Jar File. In your JAR ensure that you are also including your schedulerrpccalls.jar and the above compiled class.


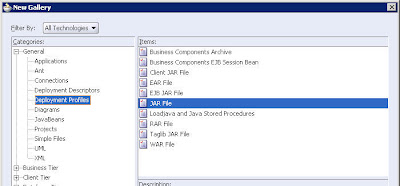
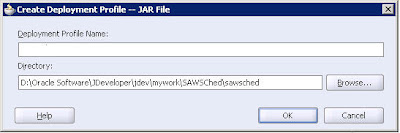
I have named my Jar file as BISched.
      
      
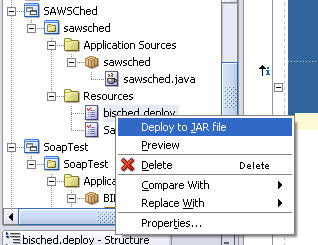
Once this is done right click on your resources ( you would find your Jar there) and then click on Deploy.
      
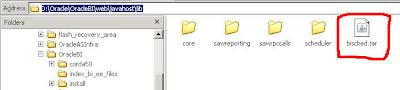
Copy your Deployed Jar file to {OracleBI}\web\javahost\lib (The one that we included in the DefaultUserJarFilePath tag).
      
5.   Now lets go back to delivers and create a simple iBot and choose Java Program in the Advanced Options.
      
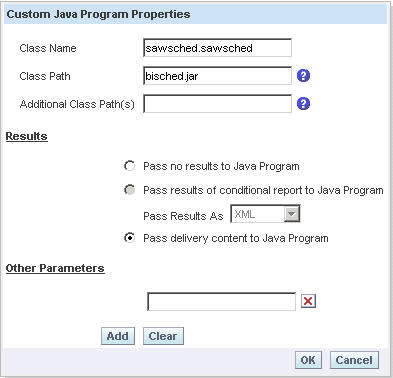
In the Java Properties enter the class name, in our case it is sawsched.sawsched and then in the CLASSPATH enter the jar file that we had bundled. Save the ibot and you would notice that a text would have been created under D drive.
      

Oracle BI EE 10.1.3.3/2 – Scheduling Cache Purging

One of the common questions that i typically get while on customer calls is how do we about purging the cache on a regular basis. Well this blog entry would give you a step by step approach for doing the same. This is just an example. You can customize this to your needs. Before going into the actual procedure lets look at an easier approach of purging the caches. If you go to the Admin tool you would basically find a cache Manager under Manager. If you open the cache manager you would find all the Logical SQL statements that have been cached. You can purge each of these one by one or you can do a Purge All.


Now lets look at automating the above process. In order to automate this we shall be using a utility called NQCMD. What this utility can do is it can accept ODBC sql calls and can execute them. So, our aim is to call this utility from an ibot via a java script. Lets first look at the syntax of NQCMD. If you go to {OracleBI}\Server\bin via command line and type in nqcmd/?, you would get the syntax as shown below.
      
So, basically it accepts the following important parameters
   1.   Username
   2.   Password
   3.   BI Server DSN
   4.   Input file containing the Purge SQL Statement
   5.   Output result file
Now, lets look at the list of steps to purge the cache one by one.
1.   Open a text editor and type in the following command. This command will be purging the cache.
      
{call SAPurgeAllCache()};
Save this file in say D drive as SQL.txt. This will be our input file.
      
2.   Lets start creating a simple javascript. Open a text editor and enter the following list of statements.
var nqCmd = “D:\\Oracle\\OracleBI\\server\\Bin\\nqcmd.exe”;
var dsn = “AnalyticsWeb”;
var user = “Administrator”;
var pswd = “Administrator”;
var tempInFileName = “D:\\SQL.txt”;
var tempOutFileName = “D:\\Output.txt”;
var wshShell = new ActiveXObject(“WScript.Shell”);
var dosCmd = nqCmd + ” -d \”" + dsn + “\” -u \”" + user+ “\” -p \”" + pswd + “\” -s \”" + tempInFileName + “\”" +” -o \”" + tempOutFileName + “\”";
try
{
wshShell.Run(dosCmd, 0, true);
}
catch(e)
{
throw e;
}
Save this file in {OracleBI}\Server\Scripts\Common as “Purge.js”. As you see above what this java script does it calls the nqcmd utility by passing in the relevant arguments.
      
3.   Now go to BI EE Delivers and start creating a simple ibot. Go to the advanced section and enter the details of the Java Script that we created. In the schedules section choose the frequency with which you would like to run this script. For testing purposes lets test this by running the script immediately
      
4.   Once this is done save the ibot. Now you can see that all the cache would have been purged and also you can see how much have been purged from the output.tx file.
      

Oracle BI EE 10.1.3.3/2 – Dates, Dates and Dates

If you had checked my previous blog entry here, you would have noticed that i had briefly touched upon the date formats that you can use to get the dates to display properly in various desired formats. Today we shall look at 3 different Date related questions.
1.   How to customize Date formats that are getting displayed in Dashboard Prompts?
2.   How to generate a new date by adding years, months etc to an existing date?
3.   How to subtract 2 different dates to produce the difference in number of years, months etc?
Lets start with the first one. It is a pretty straight forward question. All that we want to do is to change the format of Dates that are displayed in the Dashboard Prompts. For example, lets start with creating a simple Dashboard Prompt on a Date Column.
      
      
As you see above, by default BI EE has taken the TIMESTAMP format of mm/dd/yyyy hh:mm:ss. But what we would like to do is to format this date field to a format say dd-mom-yyyy. Lets go to Answers and create a simple report. Now include the same date field that we used in the dashboard prompt.
      
Now go to the column properties and change the date format to dd-MMM-yyyy (it is case sensitive).
      
Now if you see below you find a Save button. Click on system wide default for this column. So what we are doing is we are basically saving this format across all the reports that use this column.
      
Once this is done (you dont have to save the report), go back to the dashboard. You would find that the display format of the Dashboard Prompt would have changed.
      
Lets go to the 2nd question. In order to address this we shall be using a function called as TimeStampAdd. Even though this is addressed clearly in the docs, i thought i shall blog about this since this can serve as some sort of example reference for these functions. Before going further lets understand some of the following constants that we shall be using in this.
   SQL_TSI_SECOND
   SQL_TSI_MINUTE
   SQL_TSI_HOUR
   SQL_TSI_DAY
   SQL_TSI_WEEK
   SQL_TSI_MONTH
   SQL_TSI_QUARTER
   SQL_TSI_YEAR
As the names indicate the above are constants that make TimeStampAdd understand that we are basically adding second or minute or hour etc to the supplied date field. Below is the actual syntax of the TimeStampAdd function.
TimestampAdd (interval, integer-expression, timestamp-expression)
   Where interval can take any of the above mentioned constants,
               integer-expression is the value that you want to add to the date
               timestamp-expression is the date field that you are adding the integer-expression to
Now lets try adding 5 months to the same date field as mentioned above. So, if we have 10-Jan-2005, by adding 5 months we must get 10-Jun-2005. The formula that we should use is TimeStampAdd(SQL_TSI_MONTH,5,Times.Calendar_month_end_date).
      
      
You can also use these functions against some arbitrary date values ( the date values have to be supplied in ‘yyyy-mm-dd’ format). For example, TimeStampAdd(SQL_TSI_MONTH,5,DATE ’2000-10-10′).
Coming to the 3rd question above, the function that we have to use for this is TimeStampDiff. This function also uses the above mentioned constants. The syntax for this function is
TimestampDiff (interval, timestamp-expression1, timestamp-expression2)
   Where interval can take any of the above mentioned constants,
               timestamp-expression is the date field that you are subtracting
               timestamp-expression is the date field that you are subtracting from
For example, TimeStampDiff(SQL_TSI_DAY,Times.Calendar_month_start_date, Times.Calendar_month_end_date) will give the difference in days of the start and end dates.
      

Oracle BI EE 10.1.3.3/2 – Changing Default views of Compound Layout

I got another question from a customer yesterday with regard to changing the default views of Compound Layout in Answers. So, basically if you go to answers and create a new report, you would find that by default Compound layout would have have 2 views included i.e Table and Title views as shown below
      
But what the customer basically wanted was to include a filter and table view by default (i.e filter view instead of title view). The method is given in the bookshelf. But unfortunately it does not work as specified due to a documentation bug. In order to make this work, go to {OracleBI}\web\msgdb\messages folder and you would find a file called answerstemplates.xml. Copy this file to {OracleBIData}\web\msgdb\customMessages. If you dont have this folder then create it. Now edit this file and search for kuiCriteriaDefaultViewElements. This is the message that handles all the default values possible in Answers. Now add the the following tags to this message after the HTML tags,
<view signature=”compoundView” >
<cv signature=”tableView” />
<cv signature=”filtersView” />
</view>
      
Once this is done restart your presentation services. Now you would see that by default you would have got Table and Filter views within your compound layout.
      
If you notice, the methodology above is same as the one that we followed for enabling the sorting of reports in Dashboards here. So, use this methodology when you want to modify any custom XML messages.
P.S:   Happy holidays and Merry Christmas everyone!!!

Oracle BI EE 10.1.3.3/2 – Drills across Sections in a Dashboard

Another pretty interesting question came up the other day on one of our internal forums. A small variation of the question goes like this
” I have a tabular view of a report in a dashboard. I also have a chart view of a different report in the same dashboard but in a different section. So, if i click on a metric say Year 2003 on the tabular view then the graph in the another section alone(not other reports) should filter for the year 2003″
We will be seeing how to go about the achieving the above by creating 2 simple reports. Lets start with a simple report containing 2 columns. Year and Sales.
      
Create a tabular view for the above report. I have saved this report as Report4.
      
Now lets create another report with the same columns Year and Sales (for simplicity sake iam using the same columns. You can create any other report). But in this case lets create a chart view instead of a tabular view. Also create a filter on Report5 on year column with “is prompted” clause. Save this report as Report5.
      
      
Our aim is, when i click on any year in the tabular report(report4) then the corresponding chart view in Report5 should vary.
Now go back to the older report and go to the Column properties of the Year Column and in the Data Format tab change the data format to Custom Text and enter the following
What we have basically done is we have made the column to be of HTML format. Each and every column value is made to behave like a dynamic GO URL using the href tag. The href would basically point to the second report (report5) that we have created and will also pass the year value via “@” symbol. Do note the target value biee2. This is what we will use to point to a particular section. Save this report again.
Now go back to the second chart report and create a narrative view. In the narrative view enter the following
 <IFRAME src=http://localhost:9704/analytics/saw.dll?GO&Path=/shared/Paint+Demo/script+test/Report5 name=”biee2″ height=”300″ width=”200%”></IFRAME>
      
Do note the name(biee2) of the iframe that we have used above. It is the same as the target that we gave in the first report (Report4). This iframe basically points to itself (the compound layout will have the chart view and hence this will show the chart view. Ensure that you are not including the narrative view in the compound layout. Also, enable the HTML markup and restrict the number of rows to one.
Now go back to a new dashboard page and include the tabular view of the first report(Report4) and the narrative view of the second report(Report5) in the dashboard.


Now if we click on say Year 2003 the chart within the iframe alone will modify based on what we have clicked. Very simple but can be useful at times in a lot of situations.
      
This can also be achieved using Dashboard Navigation but in that case all the reports will be run again once and will also filter all the other views.

Oracle BI EE 10.1.3.3/2 – Recurring Sequence Numbers and Multi Line Column Display

Another 2 interesting questions came up in the forums today. I thought i would blog about them since these are pretty common questions that come up during actual implementations. Lets look at both of them one by one
The first question goes like this (little bit modified so that we understand how it works followed by the actual method of implementation). “How do we generate Sequence Numbers in BI EE? Also, how do we make this sequence number to restart for every value of a specific column?”
The following picture shows what is actually desired.
      
So basically we want a recursive count or a sequence number for the entire report and also a sequence number that will give a recursive count for every Country within a Region. For Achieving the Sequence Numbers all we need to do is to have a column formula like the one below
RCOUNT(1)
      
So, what this does is it automatically determines what is the unique column within the report and will generate a ROW_NUMBER() OVER (PARTITION BY {Over that Column}) clause in the query. Now in order to get the recurring sequence number over every Region we need to have a column formula like the one below
RCOUNT(1 BY GEOGRAPHY.REGION_NAME)
      
Again, what this does it generates a ROW_NUMBER() OVER (PARTITION BY GEOGRAPHY.REGION_NAME,….) clause internally to generate the desired output. This is an extension of what we saw in my previous blog entry here
Lets move on to the second question. This question primarily deals with HTML formatting that we have seen before. But it is worth mentioning here. The question goes like this “I have a column which is concatenation of REGION_NAME and COUNTRY_NAME. But what BI EE does is it prints them side by side. What i would like to have is make them print one below the other”. The 2 pics below show what BI EE does by default and what the user actually desired.
      This is what he got      
      This is what he needed      
Achieving this is pretty straight forward. Use the column Formula below
GEOGRAPHY.REGION_NAME || ‘<br>’ ||GEOGRAPHY.COUNTRY_NAME
And change the data format of the column to HTML.
      
      
Again these are very simple but can be useful in a lot of situations.