Lets get back to some useful information that we as developer need to take care of while doing our business with OBIEE as tool …. I have compiled some best practices that is true in my own view (might not be true from your end ! in that case put some comments ).
Definitely there are loads of other Best practices stuff we need to be adhered while doing our best during development / configuration and there will be tons added with some new release of OBIEE .I will promise to keep this thread up-to date whenever I will get information as it is easy to me to update here and keep this here so that there will be no additional overhead of managing the new information in documents . Keep watching this thread !!! Cheers 
Voila….
OBIEE BEST PRACTICES GUIDELINES
Repository ‐ Physical Layer
Connection Pool
1.Use individual database for every project and also specify the meaningful name for it
2.Follow proper naming convention to the database object & connection pool as per the project/business unit.
3.Use optimized number of connection pools, maximum connections for each pool ,shared logon etc.
4.Do not have any connection pools which are unable to connect to the databases as this might lead to BI server crash as it continuously ping to the connection.
5. It is advised to have a dedicated database connection for OBI which can read all the required schemas and which never expires
6.Any improper call interface should not be in the connection pool
7.Ensure to check “Execute queries asynchronously” option in the connection pool details
Others
1.Define proper keys in physical layer
2.Do not import foreign keys from Database
3.Specify the intelligent cache persistence time depending on any physical table refreshing period
4.Avoid using Hints at the Physical table Level.
5.Use aliases to resolve all circular joins
6.Avoid to create any views (SQL based objects) in the physical layer unless it is necessary
7.There should be no fact table to fact table joins
8.Use consistent naming conventions across aliases
9.Do not use a separate alias for degenerate facts
10.Search and destroy triangle joins
11.Always define your catalog under projects (typically useful for Multi User Development environment and repository merging)
Repository Design ‐ BMM
Hierarchy
1.Ensure each level of hierarchy has an appropriate number of elements e e e ts and level key.
2.No level key should be at Grand total level
3.A hierarchy should only have one grand total level
4.Lowest level of the hierarchy should be same as lowest grain of the Dimension Table. lowest level of a dimension hierarchy must match the primary key of its corresponding dimension logical tables
5.All the columns in a hierarchy should come from one logical table
6.All hierarchies should have a single root level and a single top level.
7.If a hierarchy has multiple branches, all branches must have a common beginning point and a common end point.
8.No column can be associated with more than one level.
9.If a column pertains to more than one level, associate it with the highest level it belongs to.
10.All levels except the grand total level must have level keys.
11.Should not be unnecessary keys in hierarchy
12.Optimizes dimensional hierarchy so that it do not span across multiple logical dimension tables
Aggregation
1.All aggregation should be performed from a fact logical table and not from a dimension logical table.
2.All columns that cannot be aggregated should be expressed in a dimension logical table and not in a fact logical table
3.Non‐aggregated columns can exist in a logical fact table if they are mapped to a source which is at the lowest level of aggregation for all other dimensions
4.Arrange dimensional sources in order of aggregation from lowest level to highest level
Others
1. Modelling should not be any report specific, it should be model centric
2.Joins between logical facts and logical dimensions should be complex(intelligent) i.e. 0,1:N not foreign key joins
3.It is advised to have a logical star in the business model
4.Combine all like attributes into single dimensional logical table.For e.g. Never put product attributes in customer dimension
5.Every Logical Dimension should have a hierarchy declared even if it only consists of a Grand Total and a Detail Level.
6.Never delete logical columns that map to keys of physical dimension tables
7. Explicitly declare content of logical table sources
8. Proper naming convention to be followed for logical tables and columns
9.Avoid assigning logical column same name as logical table or subject area
10.Configure the content/levels properly for all sources to ensure that OBI generates optimised SQL
11. Avoid to apply complex logic at the “Where Clause” filter.
12.Level based or derived calculations should not be stored in Aggregated tables
13. Explicitly declare the content of logical table sources, especially for logical fact tables.
14. Create separate source for dimension extensions.
15. Combine Fact extension into main fact source
16. Separate mini‐dimensions from large dimensions as different logical tables – keeping options open on deleting large dimensions
17. If multiple calendars and time comparisons for both are required (e.g. fiscal and Gregorian), then consider separating them into different logical dimension tables – simplifies calendar table construction
18. Each logical table source of a fact logical table needs to have an aggregation content defined. The aggregation content rule defines at what level of granularity the data is stored in this fact table. For each dimension that relates to this fact logical table, define the level of granularity, ensuring that every related dimension is defined.
19. Delete unnecessary physical column from here
20. Rename logical column here so that all referenced presentation column would changes cascaded
Logical Joins
1. If foreign key logical joins are used, the primary key of a logical fact table should then be comprised of the foreign keys. If the physical table does not have a primary key, the logical key for a fact table needs to be made up of the key columns that join to the attribute tables .
2.Look at the foreign keys for the fact table and find references for all of the dimension tables that join to this fact table.
3. Create the logical key of the fact table as a combination of those foreign keys.
Presentation Layer
1. It should be simple Break out complex logical models into simple, discrete, and manageable subject areas.
2.Expose most important facts and dimensions
3. All columns should be named in business‐relevant terms, NOT in physical table/column terms
4.Proper Naming Convention for all tables and columns by Initial cap Labellings.
5.Do not combine tables and columns from mutually incompatible logical fact and dimension tables
6. Ensure that aliases for presentation layer columns and tables are not used unless necessary. Verify that reports do not use the aliases
7.End‐Users should not get any errors when querying on any two random columns in a well designed presentation layer
8. Each Catalog should have the description which will be visible from Answers
9. Each Presentation column should have description visible from answers on mouse hover to it
10. Delete unnecessary columns of BMM in presentation layer
11. Avoid naming catalog folders same as presentation tables
12. If the presentation catalog is in Tree like folder structure(main and sub folders), then place a dummy measure in the main catalog folder.
13. Avoid to set permissions to tables or groups unless necessary
14. If presentation table is in tree like structure then place a dummy column as ‘_’ to enforce proper table sorting . This also help in merging activities
15. Separate numeric and non‐numeric quantities into separate folder sets. Mark “Facts” or “Measures” for column having Aggregation rules
16. Detailed presentation catalogs should include measures from one fact table only as a general rule, as the detailed dimensions (e.g. degenerate facts) are non‐conforming with other fact tables
17. Overview catalogs dimensionality is intersection of the conforming dimensions of the base facts
18. Do not use any special characters(‘$‘,’%’,’&’,’_’,’’’ etc.) for naming convention in Presentation Layer and also for Dashboards
Others
RPD Security
1.Use Externalized security for user‐group association to roll‐out large number of users
2.Users should not be stored inside the repository
3.Use template groups (i.e. security filters with session variables) to minimize group proliferation
4. Limit online repository updates to minor changes.
5. For major editing take backup copy of the repository, and edit the repository in Offline mode.
6. Use naming convention for initialization block and variable for ease of maintenance
7. Follow proper migration strategies
Report Design
Shared Folders
1. Each project or business unit will be given a dedicated shared folder on the catalog to create/save the corresponding report developments.
2.Any project specific work is not supposed to be saved in “My Folders”.
3.Dashboard, Page Name , Report Name , Web Groups should be saved to relevant business area shared folders with proper and easily identifiable naming conventions
4.Each Dashboard , Page , Report should have descriptions
Interactive Dashboard
1.Compact and balanced and Feature Rich
2.Do not use any special characters(‘$‘,’%’,’&’,’_’,’’’ etc.) for naming convention in Dashboards/reports.
3. Try to avoid complex pivot tables.
4. It’s not recommended to use Guided Navigation which effects the report performance.
5. Use single GO button for g all the prompts in the report
6.Apply the hidden column format as the system‐wide default for these preservation measures
7.Name should be meaningful for business
8. Each report can have title definition
9. Do role based personalization wherever applicable
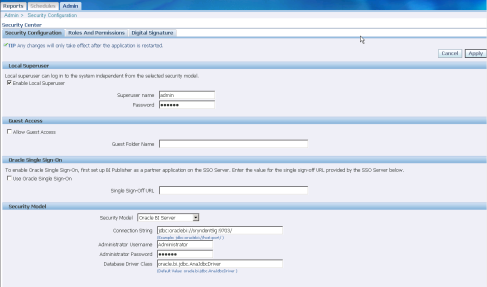
10. Answers access should be restrictive to group of users via privilege control by BI Administrator
11. Apply filter with some default value to avoid high response time
12. Avoid drop down list for filters for large set of distinct values
13. For date calendar column place it in pivot rather tabular data show
14. Always try to put a single Go
15. Make Drill in place in dashboard for Drilled down reports
16. Put the Download ,Refresh , Print link across all reports
17. 2‐D charts are easier to read than 3‐D counterpart typically for bar charts
18. Use standard dashboard layout across all pages
19. Try to keep only 3 to 4 messages per page
20. Remember people read from left to right & top to bottom
21. Always keep dashboards symmetrical, balanced and visually appealing
22. Augment basic reports with Conditional Formatting
23. Always leverage Portal Navigation, Report Navigation & Drill‐down
24. Create Visibility Roles
25. Place Filter Views underneath Title views
26. Don’t Show Detailed Filters (They look cluttered)
27. Use standard saved templates to import formatting and apply the layout
28. Use region/section collapsible features .
29. Use View selector to allow same data to be replicate across several view
30. Avoid horizontal scrolling of dashboard page
31. Remember that you can embed folders or groups of folders
32. Always Drill/Navigate from summary to detail, top to bottom
33. Always try to leverage each request view within an application or demonstration (Table, Chart, Pivot Table, Ticker, Narrative,Filter, etc.)
Performance
1. Should have no Global Consistency Errors and Warnings
2.Metadata Repository size to be Reduced to the possible Extent by removing the unused Objects
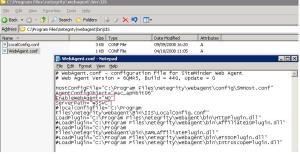
3. Optimized settings for BI server and Web server configuration file parameters
4. Applying Database hints for a table in the Physical layer of the Repository
5. Reduce the SELECT statements executes by the OBIEE Server
6. Limit the generation of lengthy physical SQL queries by Modeling dimension hierarchies (Hierarchy ( Drill Key and Level Key)
7. Disable or remove the unused initialization blocks and also reduce the number of init blocks in the Repository
8. Set the correct and recommended log level in the Production, setting the Query Limits and turn off logging
9. Push the complex functions to be performed at the database side
10. Good Caching and Purging strategy(Web server cache and Siebel Analytic Server Cache)
