Showing posts with label presentation Layer. Show all posts

Implicit Fact Column in the Admin Tool

Many a times i have heard users facing issues with server picking up improper joins in Admin tool. Lets take an example to understand this and lets c the solution….


Take an example that we have 2 dimension tables viz. Day Dim & Opty Dim and 2 fact tables viz. Revenue Fact & Order Fact. Now, I wana make my report in such a manner where i take only 2 dimension columns from the 2 dim tables and no fact column eg: I wana c number of opptys in an year.
What will happen???
When the report will run, the data will be fetched by joining the dimension(Day Dim) with dimension(Opty Dim) through a fact table(Order Fact or Revenue Fact) .Now, sometimes in these cases the server gets confused that from which fact table it should join so as to fetch the data. Then what the server does, is that, it joins with the nearest fact(eg: Order fact) and pulls the data through it.
But this can sometimes causes issues and may fetch incorrect data. Because if the user want to see the data based on the Revenue Fact and server joins with Order fact and pulls the data, then the number of Optys per Year can differ in count as there many be different Opty wids in both the facts.
I guess u got wht i meant….


So, to take care of this issue we can assign an Implicit Fact Column in the Presentation catalog in the Admin tool. This column is generally the lowest granularity column of the fact table like Row_wid etc. By setting this column in the presentation catalog the server takes the join from a particular fact table whoose column is specified in the Implicit fact column for that particular presentation catalog..


We can set the implicit fact column as shown below:
User feedbacks are invited and kindly post if you have faced or  are facing the similar issue.

Dynamic Display Name for Presentation columns

There was a question asked on this post here and I thought of having another post to answers Vik’s question.
Hi carpediemconsulting
Good Artical, Thanks
We have a Similar req at my client, but little bit different.
we have a Dimension, in that we have a hierarchy H1 with Levels, Level1, Level 2 , Level 3 we are implimenting this product for different companies, Lets say comp A, & Comp B,
In Comp ‘A’ we call level 1 as ‘Market’ and in comp ‘B’ we call it as “Location”
can we change these Level1 label dynamically when the user login. FYI . these labels are stored in TABLE
Thanks
Vik
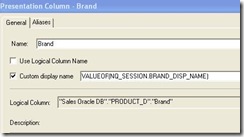
As you can see from the properties of a presentation column you could see that there is a provision to specify a custom display name.
I have two users created in the RPD. USER1 and USER2. My objective is to give a custom display name for a Column (Brand column in the Product Table). User1 would like the display to be USER1 BRAND and user2 USER2 BRAND.
I have created a session variable (BRAND_DISP_NAME) which would be initialized to USER1 BRAND for user1 and USER2 BRAND.
In the properties window for the presentation column brand do the following.
Uncheck use logical table Name check box
Check the Custom Display Name check box
Type in the name of the session variable in the text box. In my case VALUEOF(NQ_SESSION.BRAND_DISP_NAME)
Here is a screenshot.
clip_image002
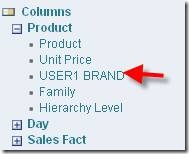
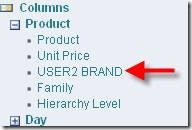
Now lets see how the column shows up for these 2 users in Answers.
USER 1
clip_image004clip_image006
As shown in the screenshots above the display name for the column “brand” is different for these two users.

Presentation Layer Objects1

Presentation Layer
- The Presentation layer is built after the Physical layer and the Business Model and Mapping layer.
- The Presentation layer provides a means to further simplify or customize the Business Model and Mapping layer for end users.
- You can create Presentation layer objects by dragging objects from the Business Model and Mapping layer.
Presentation catalogs 
- Presentation catalogs allow you to show different views of a business model to different sets of users.
- Presentation catalogs have to be populated with contents from a single business model.
- Multiple presentation catalogs can refer to the same business model.
- Presentation Catalogs can be created manually or by dragging the required from the BMM layer to presentation layer.
- Changes to the Presentation layer do not impact corresponding objects in the BMM layer.
- Presentation catalogs in the Presentation layer are seen as subject areas by Oracle BI Answers users.
Presentation Table
- Use presentation tables to organize columns into categories that make sense to the user community.
- A presentation table can contain columns from one or more logical tables. The names and object properties of the presentation tables are independent of the logical table properties.
- Presentation Tables can be created manually or by dragging the required from the BMM layer to presentation layer.
- Presentation tables contain presentation columns. Use the Columns tab in the Presentation Table properties dialog box to reorder, sort, or delete Presentation layer columns.
- To create a nested presentation table, prefix the name of the presentation folder to be nested with a hyphen and a space and place it after the folder in which it nests. When Answers displays the folder, it omits the hyphen and space from the folder name. It is possible to nest multiple folders under a single folder, however, only one level of nesting is possible.
Presentation Columns
- Presentation columns define the columns used to build queries in the Oracle BI user interface.
- Presentation columns can be created manually or by dragging the required from the BMM layer to presentation layer.
Presentation Alias
- An Alias tab appears on the Presentation Catalog, Presentation Table, and Presentation Column property dialog boxes. If you modify a Presentation layer object, this tab keeps track of any prior names.
- Aliases are used to maintain compatibility with previously written queries after an object has been modified.

Oracle BI EE 10.1.3.3 – Nesting Folders in Presentation Layer and Answers

I just saw another question pop up in the forum today with regard to nesting of folders in BI EE. This is where i believe BI EE documentation has to be ramped up a bit. I thought i would blog about it since it can cause confusion amongst users who are upgrading from Siebel 7.8 or lower to BI EE. In the earlier releases, the best practice to nest the folders was to add “-” to the front of a folder name. But the best practice has changed in the recent releases. Look at the screenshot below.
      
Our aim is to nest Geography Folder under Channels. In order to do that, open the repository and double click on the Geography Folder. Add “->” to the description. This will automatically nest the 2 folders. Remember ordering of the folders are very important for nesting to work properly. Now save it and reload the server metadata. Now you should see that the Geography Folder would have been nested under Channels.


Oracle BI EE 10.1.3.3/2 – Presentation Layer Translation

Another interesting question came up in the forums today for which there is no proper documentation or rather incomplete documentation. The question was how do we Externalize Presentation Layer i.e enable translation of Presentation Layer depending on the User Logged in Language. If you had gone through my previous blog entry here, you would have noticed that this option is primarily only for sections like Dashboard Names, Report Names etc. But this does not do the translation for the Subject Areas and their associated tables/columns. In order to do this we would have to follow another procedure called Externalizing Presentation Layer. Lets look at the steps one by one here today.
1.   Open Administration Console and right click on the Presentation Subject Area that you would like to Externalize. You would see 2 options there to externalize names and descriptions. For now lets externalize Names alone. So, click on Externalize Display Names.
      
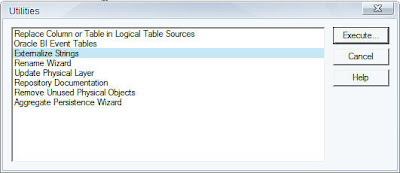
2.   Once this is done go to Tools->Utilties and Click on Execute to Externalize Strings.
      
After this, you would see a screen that would look like this. What this basically shows you is the Names of the presentation catalogs. Save this as a csv file.
      
3.   Open up this Excel file and lets understand the structure of the csv. The first column represents Actual Names prefixed by their types of the Presentation Layer. The second column represents a list of Session variables prefixed by CN_. Remember that by default CN_ would be prefixed. The 3rd column represents the actual translation. Lets modify this csv and lets add one more column called language. This language would have values of Languages supported by OBI EE(abbreviations).
      
As you see above we have done translation of individual presentation layer table names and columns to languages. English and french.
4.   The next step is to load this CSV file into a database table.
      
In our case, the name of the database table is external which contains the data of the CSV.
5.   Now lets import this table into the Physical layer..
      
6.   The first step after importing this table is to create an initialization block to initialize the LOCALE variable based on the language selected by the user in Dashboard login. To do this create a session initialization block having the data source from a database. The database sql would have a sql like this
   SELECT ‘VALUEOF(NQ_SESSION.WEBLANGUAGE)’ FROM DUAL
Also assign the target to the system session variable LOCALE. What this basically does is, whenever a user logs into dashboards the WEBLANGUAGE session variable is set. Then this variable sets the LOCALE variable using the initialization block.
      
7.   The next step is to create another session initialization block which would basically create a set of session variables using a database specific sql. The sql would look like this
      select SESSION_VARIABLE, TRANSLATION from external where LANGUAGE = ‘VALUEOF(NQ_SESSION.LOCALE)’
As you see above, this block will create all the variables whose Language match the user’s login language. Set the target of the init block to Row Wise initialization and then select the previously created init block in the execution precedence. i.e we want the 1st block created earlier to execute first.


8.   Then login to Dashboards using French as the language.


As you see above all the translations corresponding to the french language on presentation layer has happened based on the user login. The documentation for this is not extensive though it is a bit straightforward once you know how to do it.

To arrange the columns in alphabetical order automatically in presentation tables

1. Log into OBIEE Administration
2. Go to Presentation layer and right click on the table in which you want to arrange the columns alphabetically
3. Now click on the “Name” tab
4. Click Ok to get the columns in alphabetical order
5. And now observe that the columns in that table are sorted automatically

Implicit Fact Column - How to join affect the processing of multiple dimensions without facts

I recently got from one of our partner's question regarding the processing of a report, which is defined only over the columns of various dimensions (no column of the table of facts) and Metadata Repository faktovĂ˝ch there are more tables that are linked to these dimensions. Which facts BI Server uses a table to JOIN dimensions and how to preset the right? The answer is simple - the presentation layer metadata repository can be set up so-called Implicit Fact Column - the column that will automatically be added to the query when the query contains only columns of two or more dimensions, but no indicators. Implicit Fact Column is an internal column, which is not shown in the report - is used to specify a standard way join dimensions when there are several possible alternatives. It is set for each target area on the presentation layer. Properties from the menu ... press the Set ... Implicit Fact Column and select the desired facts pointer from the table. Erik Eckhardt


Quickly find out which presenation columns are used in which report


There is no easy way to find out which presentation columns are used in which reports and dashboards. I have come across a situation where we need to quickly identify presentation columns used in each report. I didn’t have enough time to go thru all reports.

To save time, I have created a tool which will output the below information.

Report path and name
Dashboard page name
Presentation column subject area name
All the Filters in the report
All the presentation column names (comma separated)

How to use this tool?

2 Launch cmd
3 In cmd pass parameters as following sequence database SID, Usage track schema user name, password.
Example:
C:\location_of_tool\ReportAnalysisConsoleApplication.exe oracle_database_SID usagetrack_USERID usagetrack_PWD > C:\output_directory_or_what_ever\AnalyzedDataOutput.txt

Prerequisites:
Report should access at least once after usage track enabled.