Showing posts with label Pivot Table. Show all posts

Horizontal Pivot Sections in obiee

In OTN forums some body has raised this question http://forums.oracle.com/forums/thread.jspa?threadID=1009297&tstart=0 Joe has done a great job by using java script 

Step1: Create a report in pivot table by giving a column in section 


Step 2
: If you want to make the Central Region,Western Region tables to be horizontal we need to add Java script code suggested by Joe.
 
---Code 
http://docs.google.com/Doc?docid=0ARnxwgf7H8OzZGdoNnE1M2hfMTIyZ3pudHEyZjI&hl=en 

Step3: Add this code to Static Text and don't forget to check Contains HTML Markup


Go to Compound Layout--->Add Pivot table and Static Text using Add view and save the report.Thanks joe for your post.......


Oracle BI EE 10.1.3.4.1 – Sub-Totals & Pivot Calculations

One intriguing or not-so obvious feature of BI EE is the way it does its Sub-Totals & Pivot Table calculations. As with any reporting tool, we expect almost every part of a report to be pushed back to the database in the form of native SQL. But there are certain cases wherein we cannot push an entire report in the form of SQL (for example Sub-Totals & Pivot table aggregations). In such cases, BI Server does these calculations in its own memory. Lets look at what this “in-memory calculation” means and how BI Server treats totals & Pivot table calculations. Since this is not documented anywhere, this behavior can be different across different releases (though i think it will work the same in all 10.1.3.* releases)
Sub-Totals:
To demonstrate how Sub-Totals work, lets start with a very simple report shown below
image
As you see, this table view report has a Grand Total. The question is how does BI Server create this Total. Does it bring the entire data into BI Server memory and then does the sub-total or does it push that back in SQL or does it write to any temporary file.
To understand this, lets start with looking at the logical SQL in the advanced tab of this report.
SELECT
Products.PROD_CATEGORY saw_0,
Channels.CHANNEL_DESC saw_1,
Sales.AMOUNT_SOLD saw_2
FROM
"SH - Training Days - Relational"
ORDER BY saw_0, saw_1
As you see this logical SQL does not actually represent the true logical SQL since the aggregation or the total part of the query is not anywhere in this SQL. So, to get the exact SQL we have to go to the Manage->Sessions & extract the logical SQL
image
SELECT
Products.PROD_CATEGORY saw_0,
Channels.CHANNEL_DESC saw_1,
Sales.AMOUNT_SOLD saw_2,
REPORT_SUM(saw_2 BY )
FROM "SH - Training Days - Relational"
ORDER BY saw_0, saw_1
If you notice, there will be a new function called REPORT_SUM which will be passed to the logical SQL. REPORT_SUM is an aggregation function that BI Server uses to calculate the total (since we had chosen Report Based Total whenever applicable in the table view). One good thing is we can take the exact SQL and fire it in the logical SQL window
image
As you see BI Server calculates the total as a column based total. There are quite a few functions like REPORT_SUM. I will list some of the common ones here
1. SUM
2. AGGREGATE
3. MIN
4. MAX
5. COUNT
6. COUNTDISTINCT
After calculating the column based total, BI Server will get the first record value in the Report Sum column and display it as Sub-Total. Now that we know what BI Server does for calculating the sub-totals in a table view, lets look at how the BI Server pushes the REPORT_SUM function. If you look at the physical query for the above logical SQL, you will notice that the report level total is not pushed back to the database. So, the question is how BI EE does this total. To determine this lets look at the {OracleBIData}/tmp folder. You will notice that for every query that has a sub-total (with database cache and presentation services cache disabled) BI EE will create temporary files in this tmp directory. The writing of temp files to this directory is governed by 4 settings in the NQSConfig.ini
WORK_DIRECTORY_PATHS = "C:\Oracle\OracleBIData\tmp";
SORT_MEMORY_SIZE = 4 MB ;
SORT_BUFFER_INCREMENT_SIZE = 256 KB ;
VIRTUAL_TABLE_PAGE_SIZE = 128 KB ;
So, when we created the above report, BI Server had created a set of temp files in the above directory. These tmp files are actually similar to the cache files but are stored seperately. But how they are handled is unfortunately not documented (though we can arrive at certain conclusions by trying various scenarios). In some complex reports, when the sub-total calculation involves a lot of intermediate rows, you will notice a sizeable increase in the size of the tmp files
image
Pivot Tables:
Pivot table is probably the most widely used Answers component. Though widely used, many a times it can eventually lead to performance bottlenecks due to a lot of in-memory calculations. Most Pivot calculations are done in the BI Server memory and are not pushed back to the database(though we can control where it is executed to an extent). As a generic rule, in any implementation, if the repository is correctly designed, almost 90 to 95% of the reports can be achieved using normal table views(unless all the reports require a specific feature like Sub-Total at the top etc). The most common reason why pivot table is quite popular is the fact that it offers flexibility to end users in slicing/dicing the data. It is treated as an alternative to a multi-dimensional reporting solution.Pivot table can sometimes hog the temp space so much that even cache writing process might fail due to memory allocation errors. For example, lets take the above report and convert it into a pivot table as shown below
image
If you notice, all i have done is i have moved a couple of columns to the Excluded section of the Pivot table. If you look at the Physical query, the SQL will still contain Product Id and Channel Desc even though they are excluded.
select T24112.PROD_ID as c2,
     T24112.PROD_CATEGORY as c4,
     T26412.CHANNEL_ID as c6,
     sum(T24170.AMOUNT_SOLD) as c8,
     sum(T24170.QUANTITY_SOLD) as c9
from
     CHANNELS T26412,
     PRODUCTS T24112,
     SALES T24170
where  ( T24112.PROD_ID = T24170.PROD_ID and T24170.CHANNEL_ID = T26412.CHANNEL_ID )
group by T24112.PROD_CATEGORY, T24112.PROD_ID, T24170.CHANNEL_ID, T26412.CHANNEL_ID
order by c6
So what this means is BI Server will do all the aggregations in its own memory or by writing to tmp files. If we look at the tmp file directory
image
As you see, a sudden 59KB file has come into the tmp file directory due to the amount of custom calculations that the BI Server has to do in its memory. The size of the files directly are related to the amount of calculations & the number of cells retrieved. So, whenever you face an issue like a Write to Tmp directory error etc, then the first place to look at is how much of calculations are being done by the BI Server. Also, as much as possible try to reduce the amount of calculations to be done by the pivot table. As more users start accessing the system, more will the number of tmp files and hence more will be the I/O. This is something to take notice of while creating Pivot Table reports.

Creating Pivot Table-Specific Filters in Oracle BI Answers

f you’ve taken a look at the Sample Sales dashboards that ship with OBIEE 10.1.3.4, you may have worked out that most of the dashboard pages use a single compound view containing multiple pivot tables, charts and tables. As such, they present many different views of data to users whilst only running a single database query per page, something that’s quite useful when you’ve got expensive database queries and lots of users.
Filterview1
If you look at how these multiple views are created, the criteria behind the request usually brings across lots of dimension attributes, lots of measures, and each of the views picks a particular set of attributes and a particular measure and displays the results as a graph, table or crosstab. Now the customer I was working with today had seen these dashboards and wanted to do something similar, but with an interesting twist – they wanted to create views on a single measure, with a consistent set of dimension attributes, but each view needed to have its own filter, so that for example, view one showed sales for one state, view two showed sales for a grouping of other states, and view three showed sales for all the other states. So is it possible to create a set of views that use their own filters, and include them all in one single compound layout?
To start off I created a simple request, like this, that brought across sales by product name and state:
Filterview2
Then I created a pivot table, that listed out products and state on the rows, and quantity sold on the columns.
Filterview3
So what I’m looking to do now, is create three of these pivot tables, one that filters on just CA, another that filters on NY and MI, and another that filters on TX and WA. To create the first of them, I use the New Calculated Item button next to the State column in the pivot table control, like this:
Filterview4
Then I create a new calculated item based on the ‘CA’ column value, and call it CA, like this:
Filterview5
When I display this new item, along with the regular dimension table values, I get an extra “CA” entry for every CA that’s coming up in the results.
Filterview6
If you then bring up the menu for the State measure again, and this time select “Hide Details”, the pivot table then hides the “regular” column values for this column and only shows the one you just created, effectively filtering the pivot table on this particular state.
Filterview7
You can even then hide this State column if you wish by using the “Hidden” option on the same menu, to just show the products sold for your particular state selection. If you then repeat this across other pivot tables and for other state selections, you can create your single compound layout with multiple view, each with their own individual filter. In the example below, we’ve taken it one stage further and added separate graphs for each view, with labels above to show which set of states they refer to.
Filterview8
Not bad, and it means you can create a single request that shows data using many different filters but with just a single database query that drives it

“Maximum total number of cells in Pivot Table exceeded” error

Pivot Tables are a great feature of Oracle BI. It is arguably one of the most used views when designing reports, and offers immediate hindsight on data with drilldown capabilities on both rows and columns.
Such intelligence power comes with a few limitations though.
Pivot Tables aren’t made to visualise large amounts of data (data dumps are best managed through normal tables or even better, direct download to Excel/flat files).
In order to optimize the performance of pivot views, Oracle BI establishes a limit of data that pivot tables can work with.
When a report retrieves a larger set of data, the following error is displayed:
image_1
Although we suggest to keep Oracle’s settings (after all, if you have a Pivot Table report retrieving millions of records at a time, maybe you should rethink your report layout or design altogether), altering the error threshold is possible.
The procedure is fairly simple and relies on the modification of the Oracle BI Presentation Services configuration file (instanceconfig.xml).
It is located in ...\OracleBIData\web\config path.
Open the instanceconfig.xml file and look for a Pivot View section, where you should find some parameters of maximum values defined.
In case the Pivot View section does not exist, the behaviour of the pivot report is driven by the default values established by Oracle.
You can find an example of the instanceconfig file below:
image_2
In the table below you can find the parameters for pivot tables to be used in the instanceconfig file, with the description and the default values for version 10 (in older versions the default value might be different, and usually lower than the value specified below).
Default values, as already mentioned, come to work in case no specific values are specified in the file.
image_3
NOTE: Modifying the instanceconfig.xml file requires a restart of the ‘Oracle BI Presentation’.

Pagination of Pivot Report OBIEE

I was working on a requirement some days back wherein I had to restrict the number of records in the Pivot table on a page. Firstly, I started to look for Pivot properties but when i didn’t get anything then i used this approach.
Follow the below steps to achieve the same:
1) Go to the criteria tab of your report and add a new column(any column).
2) In the fx of that column add the following :
     cast ((TRUNCATE(RCOUNT(1)/20,0)+1) AS INTEGER)
RCOUNT(1) is just like ROWNUM on Database and generates a sequence. Divide it by the number of records you want on a page in the report. Cast as Integer will remove the decimal places.

3) Now, drag this column and add it to the Page section of the Pivot Report and you achieve the target.
After following the above step, it looks like as shown below:

Pivot table – Conditional Coloring and Tooltips

Once I was working for a giant UK based client where we had a requirement to replace the existing .Net system . As everybody know that OBIEE is not a programming language rather a tool and there must have certain limitations as this could not be customized like a language .This is pretty hard to make a realization to them as they mostly focus on business needs rather thinking from technical perspective . Which is true indeed ! So sometime we say this is not possible very upfront and outright and sometime we need to further dig down on any alternative solution or workarounds . Sometime it is successful and sometime not . So this is all about the background of this thread and how myself succeed to help there business achievement .
The requirement was something like there would be multiple measure which need to be displayed against dimensions in pivot table . “Measure 1″  is a target achievement measure which need to be shown either Green or Red status based on target value set (target value is not hard-coded and its dynamic and driven by a backend threshold value ). For other measures at the end month there might be some order which is confirmed , some unconfirmed and some yet to be build . Now once user hover mouse to the colored cell (of those status represented in Legend) it should show the information in tooltips .A valid information in this scenario could be specifying  the dynamically changed date time window and mention the type of the period i.e building , confirmed or unconfirmed .
Lets have a look on the pivot report :
Conditional Coloring and Tooltip
Nice huh ?? I have actually googling around to get a readymade solution and unfortunately it doesn’t help . Finally after building this I even get surprised about nothing is technically impossible !
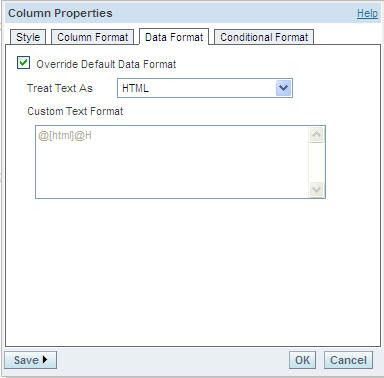
Nows lets see the how the measure and its status entirely driven dynamically in RPD  .Only change done in webcat is treating the data format as HTML .
 Conditional Coloring and Tooltip2
Conditional Coloring and Tooltip3


However you can put same calculation in Catalog itself in column formula to achieve this . But for this let BI server understand that you want “Server Complex Aggregate” to represent the conditional column measure .
Conditional Coloring and Tooltip4


The commentary is another interesting stuff where based on status of each month order Admin user want to add/update there comments which navigated to a target where Writeback has been implemented . Commentary code is like below :

Conditional Coloring and Tooltip5

Calendar View in OBIEE and Applications

Calendar View in OBIEE with Year selection.
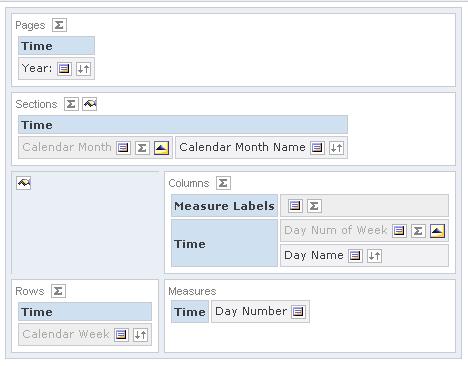
Here is the Pivot Layout, you can see the columns used ..
Don’t forget to set an aggregation rule to Max or Min (not sum) for Day Number column there in Measure block of Pivot.
Calendar Week is the column which treat Sunday to Saturday as one week from day starting of year, but not like 1 to 7 is one week, 8 to 15 is 2nd week…
Here is the output:
Applications are like:
Enable a drill report on the day number column to know the transactions for that date..
(it’s not straight forward.. but, possible. If i get time, i’ll come up with an article about that.. )

Pagination or “Page Contol” in OBIEE Pivot View

There are several blog entries which explains about pagination in OBIEE Pivot
Please, include this entry also in that list. J
Suppose, i want to see 10 rows for every page in pivot.
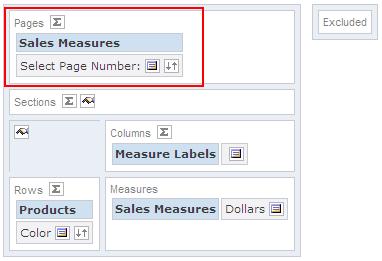
Apart from the columns selected in the criteria for particular request, select another column and modify it’s functionality to CEILING((RCOUNT(1))/10.0). Now, change it’s column heading as:Select Page Number:  and drag this column into Pages block of Pivot
Pages of Pivot
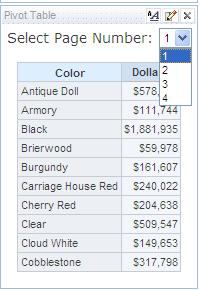
Results are like:
Pagination Control
Note: In denominator of the formula, use ‘10.0’ instead of ’10’.  If you use 10, page Numbers are populated  from ’0′ and in the 0th page only 9 records will be shown for this particular scenario.
 

Oracle BI EE 10.1.3.3/2 – Conditional Formatting based on multiple character columns in a Pivot Table

Use this approach only if you have no other options. Also, this would work only if you have non-numeric columns(on which you want to apply conditional formatting). Not an elegant solution but would work neverthless. As the title of this blog suggests we shall be looking at an approach to enable cross column conditional formatting on Pivot Tables. You might probably be aware of the fact that BI EE does not support cross column conditional formatting in Pivot Tables. This is stated very clearly in the New Features Guide here. But what if your end user somehow wants this feature. In such a case, just follow the below mentioned procedure. Lets start with a simple Pivot table report as shown below
     
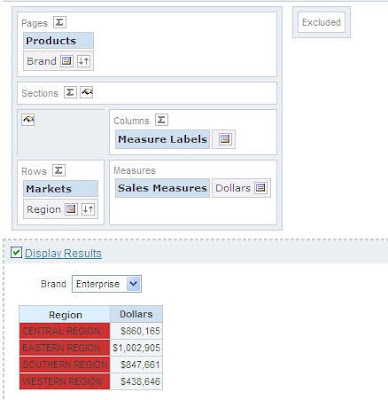
The above report gives a report on the Region, Brand and their corresponding sales. Now, our aim is to highlight all the Regions in Red whose Brand value is Enterprise. In a tabular view this is straightforward since it supports cross column conditional formatting. But since in our case this is a pivot table, go back to the criteria tab and edit the formula tab of the Region column. Type in the below formula.
‘<!– ‘|| Products.Brand||’ –>’||Markets.Region
     
Now, convert this column to a HTML format.
     
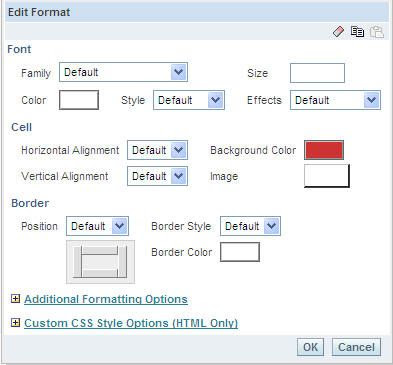
Once this is done, go to conditional format of this column and give the necessary conditional formats (You would have to choose all the 4 Enterprise Brands||Regions. This is the main drawback with this approach. It would really nice if conditional Formatting supports the containsAny operator ).
     
     
Now, if you go to the pivot table you would notice that all the regions which are under the Enterprise Brand would be highlighted. The idea is to basically concatenate the columns and then apply the conditional formatting. The formula above (which is nothing but HTML commenting) will avoid the display of the columns multiple times.
     
     
Not the best solution but can be useful if you somehow need to use cross-column formatting in pivot tables.