Showing posts with label guided. Show all posts

Using Guided Analytics with OracleBI Dashboards

In yesterday’s posting, I looked at how drop-down lists can be used to change the values displayed in a report, and to change the type of visualisation from one type of graph to another. In today’s posting, I’ll look at using the guided analytics feature of BI Suite Enterprise Edition to help a user investigate a business event.
In this scenario, I wish to alert my sales managers if any of the sales in a region fall below a predefined limit. If sales do fall below this limit, I wish to do two things:
  1. Display an alert on their dashboard page, guiding them to a special “Sales Below Threshold” dashboard page to start looking into where the problem came from, and
  2. Add an addition report to their regular dashboard showing sales for each region, highlighting those that are above and below my threshold.
To start off the process, I put together my “Sales Below Threshold” dashboard page, add some charts and tables, and then use the dashboard properties to set the page as hidden – we only want to make this available through the guided analytics feature.
Now that my Sales Below Threshold dashboard is defined, I want to define a request that, again will only come up if the alert is triggered, and will display the performance of each region this year. To do this, I go into Answers and build a table with the required figures.
Now, so that my user really knows that there is a problem, I will add some conditional formatting to the Region column to illustrate the point. Notice how the condition column doesn’t have to be the same as the column you’re formatting, so that for example you can colour one column based on the values in another, in my case the Units column (something Discoverer can’t do).
In my case though, I’m not going to just change the colour of the column value – I’m going to add an gauge image next to the region name as well, to really drive home the point.
Now, when I view the request, there’s an image next to each region showing quickly which ones are on target and which ones aren’t.
The next step is to define a report that I can pass to Delivers to trigger my alert. The report will return rows if any of the regions have sales below 70,000 units.
I then save this report as “Region Sales Alert” and move over to Dashboard.
Now, I add the previous Answers report, the one with the gauges, to the dashboard in it’s own section; however, before I go back to the dashboard view, I click on the properties button for the section I put the report in, and select “Guided Navigation” from the menu, to tell Dashboard to only display this section under certain conditions.
Using the dialog that comes up, I select the report I just created – the one that returns a row if a region sells below 70,000 in 2005 – and nominate this as the condition.
Now, this section will only display if the associated condition – the request that checks whether any region’s sales are below 70,000 – is true.
The final bit is to add some narrative to the dashboard, based on the same condition, that directs the user through to the Sales Below Threshold dashboard I created earlier, should this condition arise. To put this in place, I stay in the dashboard edit view, and add a Guided Navigation Link from the left-hand side of the page to the section I just created, like this:
Then, using the properties dialog for the Guided Navigation Link, I tie it to the dashboard I created earlier, and add some narrative text to bring it to the user’s attention.
Now, finally, when the user views the dashboard, and the condition is met – sales for a region fall below 70,000 – the additional report, plus the guided link through to the additional dashboard, are displayed.
In the final posting tomorrow, I’ll round off by talking about adding column selectors, telling the dashboard to drill in place, and drilling from one report to another.

Guided Navigation

Guided navigation is one of the best features in the OBIEE Interactive Dashboard. Guided navigation helps users gain insight into business issues and appropriate actions to take based on results obtained from Oracle Business Intelligence. You can use guided navigation function to alert if the source report is meeting your set condition.
Let me take an example to demonstrate the function of guided navigation.
Let us assume that we have sales by region report and if any of the country’s sales drops by a set target baseline dollar. It should alert on the dashboard so that the country’s sale manager can look into the details of sales and take action based on the report.
Create two reports, one source report where you can set any condition and a target report where you want to display details based on the source report condition.
Source Report: Create a sales summary report as below and set a filter (target condition) as 7,27,972 on the amount sold column.
Target Report: Create a simple sales details report showing country wise customer report.
Create Guided Navigation on the Edit option of Interactive dashboard page.
On the source request section, upload the report which has condition (filter of sales target).
There are two types of links.
1. Static Link – If you select NO on the reference source request. It becomes static link and it will always appear on the dashboard.
2. Conditional link – If you select YES on the reference source request. It becomes conditional link and it will appear when the condition is met in the source report.
Select Yes on the reference source request. Upload the source report in the source request and click on NO on the show link.
Upload the target report (sales detail report) in target and provide a caption. You can also provide any URL in the target section.
Save the section and return to dashboard. Create a country name prompt on the dashboard. Select any country name in the prompt and click go. If the selected country’s sale is greater than target dollar, the guided navigation will not appear. If the selected country’s sale is less than the target, a guided navigation link will appear as below.
The selected country’s sale is below the set target condition, so you can see the guided navigation link appearing on the dashboard. Click on the link to get the detail report with customer sales as below.

Oracle BI EE 10.1.3.3/2 – Input box data validation using Guided Navigation Sections

Couple of days back we had seen how to go about achieving input box data validation using custom Java scripts here. One of the drawbacks as mentioned there was that it applies the validation to all your edit prompts. Though you can still further modify the java script to make it work only for your dashboard prompt but again that would entail lot of custom coding from our end which sometimes is a overkill for such a small feature. So, lets look at another approach today which would use Guided Navigation sections. Lets start with an example wherein we have a dashboard prompt on AMOUNT_SOLD column (using between). Below the dashboard prompt we have a report containing PRODUCT_NAME and AMOUNT_SOLD(this contains a filter on AMOUNT_SOLD with is prompted clause). So, first lets check whether the filter works by entering proper values.
      
The problem with this prompt is if we enter some char values you would find that this results in an error which many users would not like.
      
So our aim is to hide this report whenever wrong data is entered rather than this error. In order to achieve this go to the dashboard edit page and ensure that you have both the prompt and the report in different sections (if you have more reports this report alone should have a seperate section). Now go to the section properties(the section that contains the report) and click on Guided Navigation. In the Guided Navigation properties, reference the source request and reference the same report that we have used above. So, basically our aim is to hide this section when it does not return any data or any error.
      
      
Lets test it out by giving some character data.
      
As you would see this would not show the report at all if we enter any wrong data which is better than the error message.

Oracle BI 10.1.3.3/2 – Selecting Reports from Dashboard Prompts and Guided Navigation Sections

While i was away on vacation, a set of pretty good questions came up as comments in the Contact Me page of this blog. Though i never expected this page to get any comments at all, it looks like i was wrong. So, apologies to everyone who have been waiting for a reply from my end. I plan to make a reply as soon as a comment is made from now on. Among those comments, one user had a question on how to go about creating a dashboard prompt to list down specific report names and while selecting the report names the user wanted to show those corresponding reports within the dashboard. I have had this question asked before. Though it is not pretty straight forward to achieve this, lets look at one of the possible approaches today. In order to do this, lets start with a very simple example. You can modify this to suit your needs. In our example, our aim is to make the dashboard prompt to show two report names ‘Brand Sales’ and ‘Region Sales’. Based on what we select in this dashboard prompt we would be showing either the Brand Sales Report or the Region Sales report in the dashboard. Lets start with creating the dashboard prompt. For now we shall be hardcoding the values in the dashboard prompt.
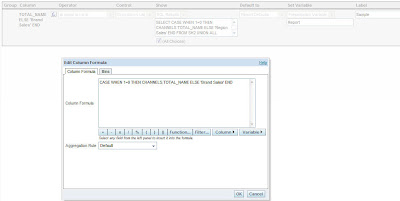
So, create a dashboard prompt on a column (though this column will not be actually used. This is just to trick the BI Server) and in the formula enter the below case statement.
      CASE WHEN 1=0 THEN CHANNELS.TOTAL_NAME ELSE ‘Brand Sales’ END
As you see the idea is not to filter on the actual column but instead on a dummy value of Brand Sales.
      
Once this is done, go to the Show drop down and go to SQL Results. In the SQL Results enter the below SQL. Also, make the prompt to set a presentation variable say Report
      SELECT CASE WHEN 1=0 THEN CHANNELS.TOTAL_NAME ELSE ‘Region Sales’ END FROM SH2 UNION ALL SELECT CASE WHEN 1=0 THEN CHANNELS.TOTAL_NAME ELSE ‘Brand Sales’ END FROM SH2
      
As you see above, what we are basically doing is making the dashboard prompt to print our Report Names and then we are making the presentation variable to accept these report name values. Now the next step is to create 2 reports that each will return rows for one of the above selections and zero rows for the other selection so that we can use this as a source for our guided navigation section.


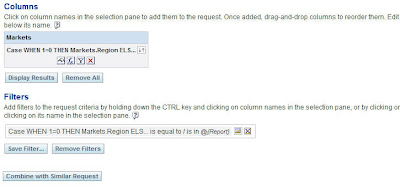
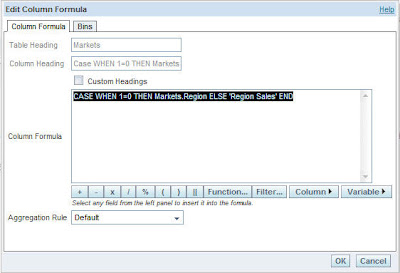
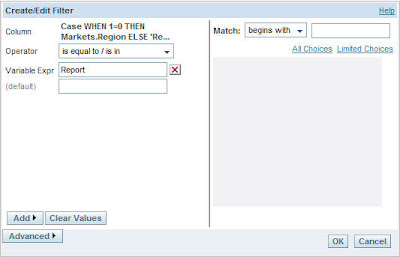
What we are basically doing above is creating a report that just has a column with a dummy valueRegion Sales. And a filter is applied on this report with the presentation variable Report so that this report will return non-zero rows when we choose Region Sales value in the dashboard prompt. Similarly this report will return zero rows if we choose Brand Sales value in the dashboard prompt. Create another report as shown above but in this case make it to return non-zero rows when Brand Sales is chosen.
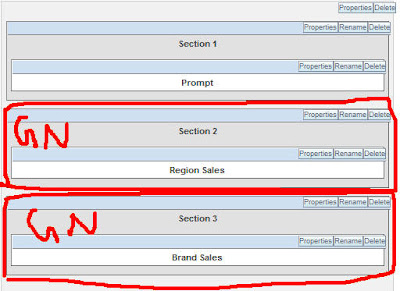
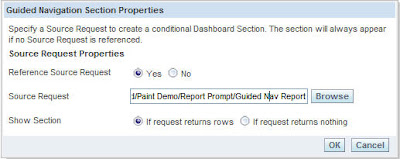
Now go to the dashboard and include the dashboard prompt that we created in a normal section. Now included 2 other sections below this dashboard prompt and each of these sections would be a guided navigation section. Include the region sales report in GN section and Brand Sales report in the other GN section. Go to the GN section properties containing the Region Sales Report and in the source, reference the report that we created above and make it to show only when it returns some rows. Similarly, for the GN section containing the brand sales report, reference the second report that we created above and make it to show only when it returns non-zero rows.
      
      
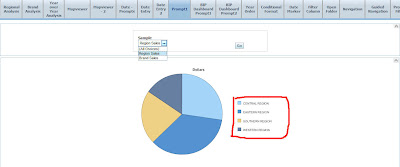
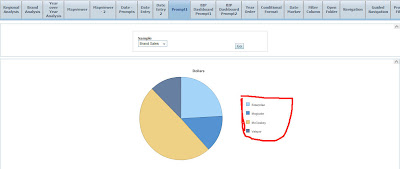
Now if you go choose Brand Sales in the Dashboard prompt, you would see that the Brand Sales report would be listed. Similarly if you choose Region Sales, then the Region Sales report would be shown.
      
      
The idea is pretty straight-forward. But this can be used especially if you want to allow your users to choose multiple reports.