Showing posts with label drilldown. Show all posts

Oracle BI EE 10.1.3.4.1 – Sub-Totals during Drills – Conforming Dimensions

I saw a peculiar requirement being discussed in a pentaho forum(i was actually browsing for some unique Pentaho features and stumbled upon the requirement) this week wherein end users wanted to get the sub-totals automatically while drilling on a dimension. In normal cases, i would have left it as a unique requirement and would not have tried to replicate in BI EE. But when i thought about this requirement further, it somehow seemed like a very common requirement to me. Whenever i look at my phone or internet bills, i always look for sub-totals. Without them a reporting tool would be incomplete. And BI EE does offer some good sub-total features out of the box. But what is not available is an automated Sub-Totaling feature after drilling down on a dimension in a dashboard. Many might argue that when we do the drill we are actually drilling from a Total to its individual values. But again sometimes end users would like to have this feature (atleast i would love to have this in BI EE).
There are couple of options to enable this. Both of them require some good amount of work (for a small feature) in the repository. I would recommend to use either of the solutions only for a dimension or 2 with not more than 4 to 5 levels. It is possible to use this for more than 3 dimensions as well but the repository can grow in size pretty quickly. We shall be seeing a technique that leverages the Conforming dimensions concept of BI EE. Conforming dimensions can be explained easily by the diagram below
image
As you see, whenever 2 different dimensions form 2 logical table sources for the same dimension and we have 2 different fact tables, then the dimension and fact combination would produce a union of the dimension members. The basic premise behind conforming dimensions is the fact that there is no linkage between the dimensions nor the fact themselves. That is Dim1 should be related to Fact1 alone and Dim2 should be related to Fact2 alone. If there is any relation between Dim1 and Fact2 or vice-versa, BI Server would not treat them as conforming dimensions.
With that background lets move on to the actual requirement. Producing dynamic sub-totals. The idea is very straight-forward. We make every member that we drill on to be a member in the column that comes up after drill (in addition to the child members of the parent member that we drilled on). For example, consider the report below
image
As you see, while drilling on Channel total member, we get the children of that member in addition to the member itself which simulates a sub-total. If we have n levels in a dimension when we model it we would have to model it as having n+1 levels. For example, in our example the Channel Dimension has 3 levels. Channel Total –> Channel Class –> Channel Desc. So, when we model in our repository, we need to basically have 4 levels as shown below.
image
According to the conforming dimension concept explained above, in order to ensure that BI EE fires different queries for every fact table, we need to create 3 aliases for the Channels dimension and 3 aliases for the fact table.
image
Include all the 3 channel aliases as logical table sources for the channel dimension. Now, ensure that mappings of the sources follow this table.
image
Also create 3 separate fact tables with the same aggregation for the amount measure. Each fact table will be sourced by a Fact alias
image
Now, for normal reports that do not require this capability, just pull in the dimension and one of the fact alias tables. Wherever this sub-total drill is required one would have to ensure that all the fact measures from all the fact tables are chosen. This will ensure that conforming dimension join kicks in as shown below.
image
image
From here on, its just a matter of combining all the facts into a single fact using the formula below
IFNULL(SALES.AMOUNT_SOLD,IFNULL("SALES1".AMOUNT_SOLD,0)+IFNULL("SALES2".AMOUNT_SOLD,0))
imageimage
The position of the sub-total can be easily  controlled by adding one more sort order column in all the Logical table sources.

Oracle BI EE 10.1.3.4.1 – Drills on Union Requests – Fragmentation

One another issue with BI EE is the fact that, whenever we try to build a report with a Union All request, we would lose the capability of using repository based drills in the front-end. There was a question recently on how to overcome this limitation. This is very valid whenever we are trying to mimic a multi-dimensional report using a relational database wherein one can pick and choose the members from multiple levels. The most common way of reporting on multiple levels within a single column is to use Union-All directly from Answers. But we would lose the drills on this single column which sometimes defeats the purpose. In order to overcome that, lets look at a repository design technique wherein we can provide drills on such Union-based requests as well.
To illustrate, lets use the Product dimension. Lets assume the requirement is to have the values of PRODUCT_CATEGORY and PRODUCT_SUBCATEGORY columns in a single row as shown below.
image
The idea is provide drills on both the category as well as Product Sub-category values in the above report. The design that we would be using today, to an extent can help us in achieving parent-child hierarchy reporting as well(i would be covering this in a future blog entry).
To start with, the approach is to have as many aliases as the number of columns that we would be needing in our union all request. Lets say, if you have 4 levels in your hierarchy, i would create 4 aliases of that dimension and also the facts. This is not hard-coded by any means as even if you have 4 columns, you can still pick and choose the columns that you want to do Union-All using a filter.
image
Now, create 3 custom columns in the Product Dimension. The first column will correspond to the Level ID and the 2nd will correspond to the Level Name. The third one basically point to the hardcoded column Name. Now bring in both the Aliases of the Product Dimension as logical table sources for the product dimension.
image
In the first logical table source make the Level1 ID, Level 1 Name and Source columns to point to PRODUCT_CATEGORY related columns.
image
In the second logical table source, make the Level1 ID, Level 1 Name and Source columns to point to PRODUCT_SUBCATEGORY related columns.
image
Setup a hierarchy for the Product dimension as shown below.
image
Now ensure that both the logical table sources would be used using Fragmentation.
image
The above is generally done in the fact logical table sources. But i would recommend doing this in the dimension as well so that we can have more control while creating reports without facts. Also, setup the same fragmentation as above in the fact logical table sources as well. Now, lets create a report containing the Level1 Name and a fact measure. You would notice that you would have a union all request getting fired automatically.
image
select D1.c1 as c1,
     D1.c2 as c2
from
     (select D5.c2 as c1,
               sum(D5.c4) as c2,
               D5.c3 as c3
          from
               ((select T5226.PROD_SUBCATEGORY as c2,
                         T5226.PROD_SUBCATEGORY_ID as c3,
                         T5257.AMOUNT_SOLD as c4
                    from
                         PRODUCTS T5226 /* Products - B */ ,
                         SALES T5257 /* Sales - B */
                    where  ( T5226.PROD_ID = T5257.PROD_ID )
                    union all
                    select T5203.PROD_CATEGORY as c2,
                         T5203.PROD_CATEGORY_ID as c3,
                         T5249.AMOUNT_SOLD as c4
                    from
                         PRODUCTS T5203 /* Products - A */ ,
                         SALES T5249 /* Sales - A */
                    where  ( T5203.PROD_ID = T5249.PROD_ID ) )
               ) D5
          group by D5.c2, D5.c3
     ) D1
order by c1
We should be able to drill on Product Category as well as the subcategory.
image
image
The next question is what if we want to choose the columns (either Product Category or Product Sub Category). In such a case, just add a filter on the source column as shown below
image
This will restrict the report to only the Sub Categories. Drills would still be available.
image 
This approach can be used for those dimensions where every level is treated more or less the same (like a multi-dimensional drill). The downside with this approach though is, if we need this on all the dimensions, then the number of logical table sources can sometimes become too large to manage.

Oracle BI EE 10.1.3.4.1 – Drills without Automatic Filters – Discoverer Style Drills – Repository Design

One of the questions that i was asked recently is a means for doing discoverer style reporting in BI EE. As you might probably know, one of the major drawbacks of BI EE (atleast untill 11g comes out) is the fact that during drills we lose the information about other contextual values. For example, if you look at the screenshot below, we have a normal Product hierarchy setup within the repository.
tmpC0
So, when we drill from Product Category to Product Sub-category, BI EE automatically will apply a filter on the contextual drilled Product category. For example, drilling on Electronics will apply a filter on Electronics to the report.
tmpC1
What if we want a capability wherein drilling on Product Category level will take us to the next level without filtering the report itself. And what if end users want both the capabilities in a single report. This kind of capability can be provided to an extent by a very simple repository design technique.
To start with, our goal is to have 2 columns for each level. One column will provide normal BI EE drills and the other will provide a drill without filter. The question is how do we bypass the filtering of a report as that is something we cannot control from the UI (without using Navigation). In order to negate the effects of filtering, we need to introduce a new column for every level in the dimension which will have a constant value as shown below
tmpC2
Now, include these new columns in the dimension hierarchy as shown below.
tmpC3
Ensure that the new columns introduced are part of the drill key with drill enabled.
image 
The idea is now, every level will have 2 options. If we drill on the actual product column name, we would get normal drills. And if we drill on the custom columns, we would get the drills without contextual filter.
 image
When we click on Drill Level 1, we would get the new level without any filters (remember the position of the columns above is important). Actually there would be a filter, but that is a filter equivalent to 1=1.
image
image
But if you click on the Product Category, you would still be having the normal drills.
tmpCE
tmpCF
The major advantage with this is the fact that you can mix and match the drills as you traverse the hierarchy. This would be very useful for analysts who want to compare the filtered contextual data with an un-filtered contextual data.

Oracle BI EE 10.1.3.3/2 – Conditional Drills and Dynamic Tool Tips – HTML Formatting and GO URL

I got these 2 questions via email yesterday. We have discussed a variation of the above questions before. Lets look at both the questions one by one.
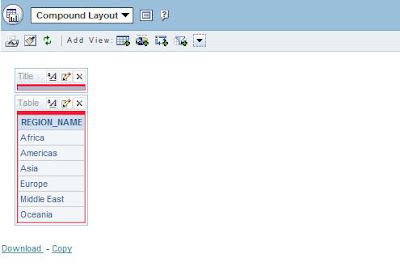
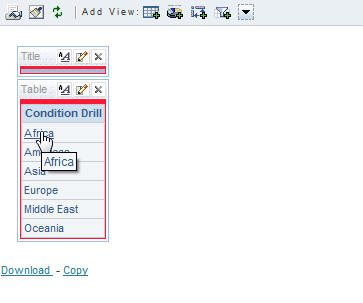
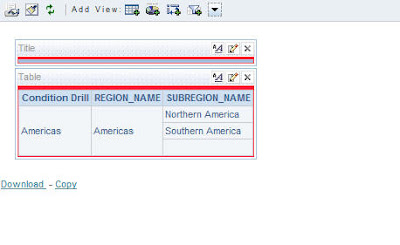
Question 1: How can we enable Conditional Drills for a column? i.e. if you look at the screenshot below, we have a very simple report containing only the region names. Based on the Region Values, is there a possibility to drill down to different reports. For example, i would like to drill down to say Report A for Asia Region and for other Regions i would like to have the default drill enabled.
      
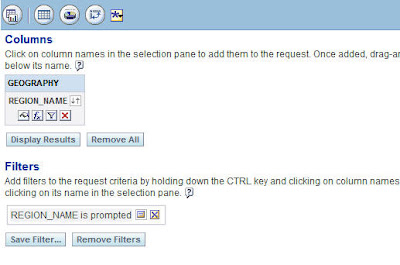
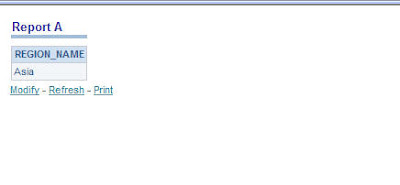
This is a pretty interesting question since currently BI EE does not have the capability to setup conditional drills in the Repository. Lets look at a simple way of achieving this using HTML formatting. Of course, this is applicable only for tabular views. Lets start with creating a simple target Report (Report A for the drill on Asia Region) containing only the Region Column. Create a filter on this column with is prompted clause.
      
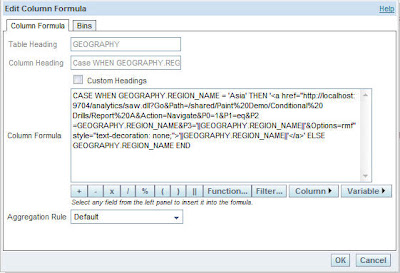
Now, start creating the main report with only the Region Column. In the formula tab of this Region Column, enter the below formula
CASE WHEN GEOGRAPHY.REGION_NAME = ‘Asia’ THEN ‘<a href=”http://localhost:9704/analytics/saw.dll?Go&Path=/shared/Paint%20Demo/Conditional%20Drills/Report%20A&Action=Navigate&P0=1&P1=eq&P2=GEOGRAPHY.REGION_NAME&P3=’||GEOGRAPHY.REGION_NAME||’&Options=rmf” style=”text-decoration: none;”>’||GEOGRAPHY.REGION_NAME||’</a>’ ELSE GEOGRAPHY.REGION_NAME END
      
Now, convert the data format of this column to HTML. Now when you click on Asia, it will take you to Report A with Asia as parameter being passed to that Report. For other Regions, normal drills would happen.
      
      
Question 2: How do we Produce Dynamic Tooltips in a Report?
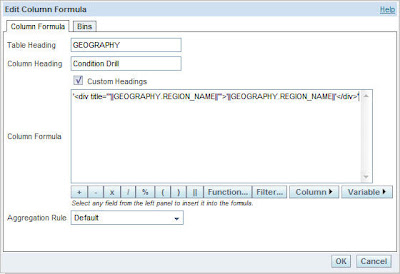
Again, this is pretty straight forward if you know HTML tags. But remember this would work only for Tabular views. Lets start with the same simple report containing Region names. In the formula tab enter the below formula
‘<div title=”‘||GEOGRAPHY.REGION_NAME||’”>’||GEOGRAPHY.REGION_NAME||’</div>’
      
Convert the column to HTML format.
      
Now, you should be able to get the column values themselves as the tooltip in your tabular report.
      

Oracle BI EE 10.1.3.3/2 – Drilling on Measures – Passing Multiple Parameters during Drills – Go URL and HTML Formatting

One of my colleagues within Oracle called me today with regard to a pretty interesting issue that he was stuck up on. Basically, he wanted to find a method of drilling on measure values by passing some of its dimensional attributes as filter to another report. As you would probably know, when we do drilling we would be passing the value of the drilled column as filter to the subsequent report. But in the above case, he wanted to pass 2 or 3 other dimensional attributes. If you are not sure about what i mean, look at the sample report below
      
As you see above, we have a simple report, containing Region, Country and the corresponding sales. Now the issue is how do we pass the Region and Country as parameter to another report while drilling on sales i.e in the above report when we click on 7,264,336 we should pass on Asia and Japan as parameters to another report. In order to achieve this lets start with creating the 2nd report containing the same Region, Country and Cost instead of sales. Now add 2 filters to this report on Region and Country with is Prompted clause.
      
Now, lets go back to the first report. The idea is to convert the sales column into a HTML href column and then pass the parameters to the 2nd report using GO URL. In the formula tab of the Sales column enter the below formula,
      ’<a href=http://localhost:9704/analytics/saw.dll?GO&path=/shared/Dynamic%20GO%20URL/Report2&Action=Navigate&P0=2&P1=eq&P2=Geography.Region&P3=’||Geography.Region||’&P4=eq&P5=Geography.Country&P6=’||Geography.Country||’ style=”text-decoration:none;”>’||CAST(Sales.Amount_Sold AS CHAR)||’</a>’
And convert the above column into HTML format.
      
So, basically what we are doing is we are calling the 2nd report using GO URL and also passing the other row-dimensional attributes like Region and Country to the GO URL. The formula has such a format in order to make the column as a HREF link. Now if you click on the measure it would pass all the dimensional attributes to the target report.
      
      
A very simple technique but again can be very powerful since it can pass multiple parameters at the same time.

Oracle BI EE 10.1.3.3/2 – Drills across Sections in a Dashboard

Another pretty interesting question came up the other day on one of our internal forums. A small variation of the question goes like this
” I have a tabular view of a report in a dashboard. I also have a chart view of a different report in the same dashboard but in a different section. So, if i click on a metric say Year 2003 on the tabular view then the graph in the another section alone(not other reports) should filter for the year 2003″
We will be seeing how to go about the achieving the above by creating 2 simple reports. Lets start with a simple report containing 2 columns. Year and Sales.
      
Create a tabular view for the above report. I have saved this report as Report4.
      
Now lets create another report with the same columns Year and Sales (for simplicity sake iam using the same columns. You can create any other report). But in this case lets create a chart view instead of a tabular view. Also create a filter on Report5 on year column with “is prompted” clause. Save this report as Report5.
      
      
Our aim is, when i click on any year in the tabular report(report4) then the corresponding chart view in Report5 should vary.
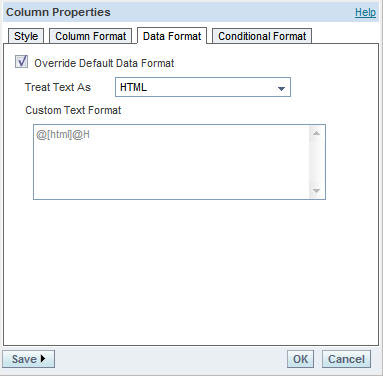
Now go back to the older report and go to the Column properties of the Year Column and in the Data Format tab change the data format to Custom Text and enter the following
What we have basically done is we have made the column to be of HTML format. Each and every column value is made to behave like a dynamic GO URL using the href tag. The href would basically point to the second report (report5) that we have created and will also pass the year value via “@” symbol. Do note the target value biee2. This is what we will use to point to a particular section. Save this report again.
Now go back to the second chart report and create a narrative view. In the narrative view enter the following
 <IFRAME src=http://localhost:9704/analytics/saw.dll?GO&Path=/shared/Paint+Demo/script+test/Report5 name=”biee2″ height=”300″ width=”200%”></IFRAME>
      
Do note the name(biee2) of the iframe that we have used above. It is the same as the target that we gave in the first report (Report4). This iframe basically points to itself (the compound layout will have the chart view and hence this will show the chart view. Ensure that you are not including the narrative view in the compound layout. Also, enable the HTML markup and restrict the number of rows to one.
Now go back to a new dashboard page and include the tabular view of the first report(Report4) and the narrative view of the second report(Report5) in the dashboard.


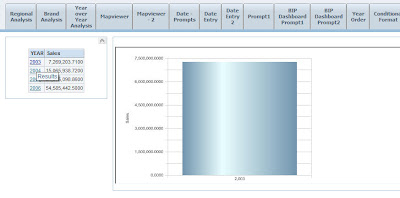
Now if we click on say Year 2003 the chart within the iframe alone will modify based on what we have clicked. Very simple but can be useful at times in a lot of situations.
      
This can also be achieved using Dashboard Navigation but in that case all the reports will be run again once and will also filter all the other views.