Simultaneous display of N and N worst best

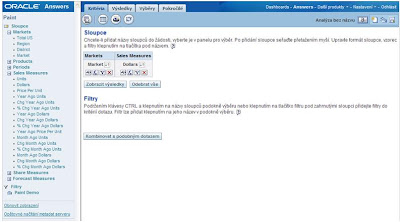
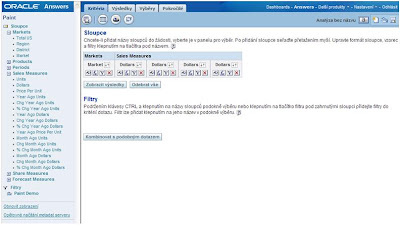
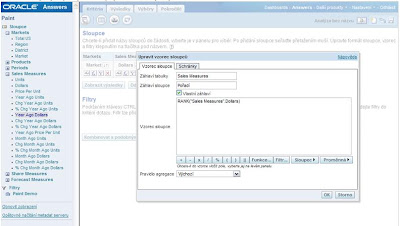
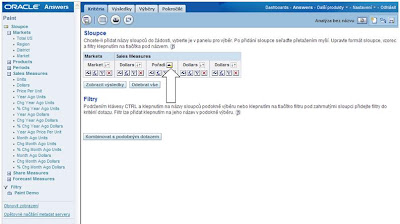
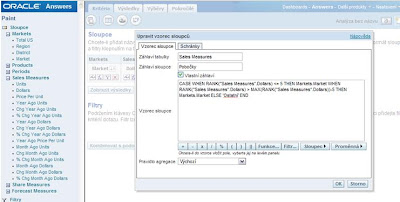
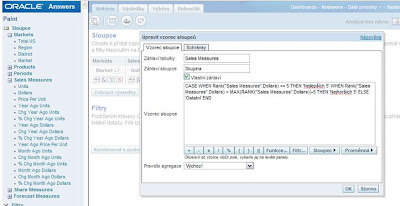
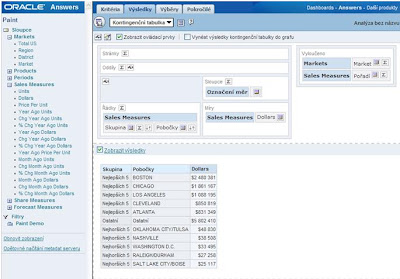
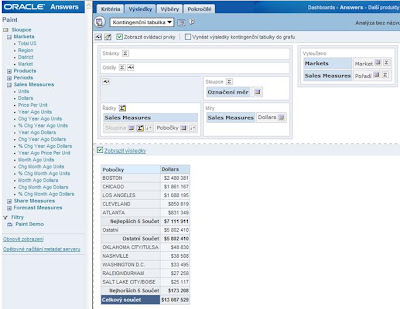
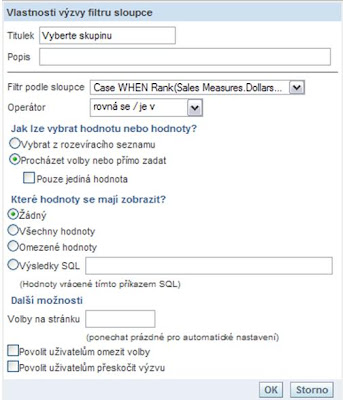
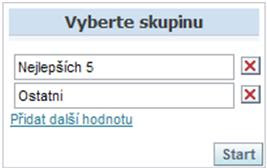
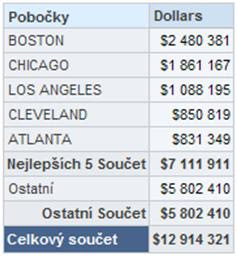
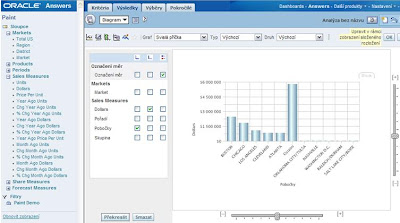
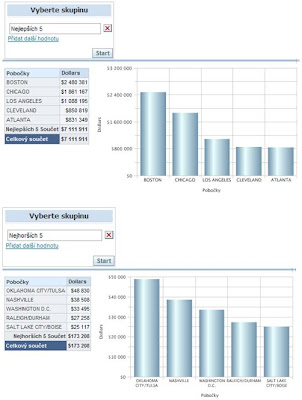
On the last training, I demonstrated an example of the customer list and Top N Other . Fell question whether it was in the same assembly simultaneously write "N" best and "N" worst. Below you will find a solution by the demonstration by "Paint": 1st Select One column with the dimensions and facts a second The same facts have to add a column 33rd His second appearance edit (Edit column) 4th On the same column set sort 5th Next column will be used to determine which of the lines are among the "Top 5" and the "Worst 5". Choose again, "Edit Column" (fx button) and use the following CASE statement: CASE WHEN RANK ("Sales Measures". Dollars) <= 5 THEN WHEN Markets.Market RANK ("Sales Measures". Dollars)> MAX (RANK (" Sales Measures ". Dollars)) -5 Markets.Market THEN ELSE 'Other' END In this modified column will display the names of branches (dimension values) in the event that one of the first or the last 5. Otherwise, this column "Other" 6th The last column will serve as an aggregation group "Top 5", "Worst 5" and "Other". Click again on the "Edit columns" and apply the following formula: CASE WHEN Rank ("Sales Measures". Dollars) <= 5 THEN 'Top 5' WHEN Rank ("Sales Measures". Dollars)> MAX (RANK ("Sales Measures" . Dollars)) -5 THEN 'worst 5' ELSE 'Other' END This now looks like a list of columns in the selection criteria: 7th Now switch to PivotTable. Exclude column and Market Order (original dimensions). In the column, leaving only the rates of Dollars (facts table) and the Group column and place the branches to the section lines: 8th Column group to hide and make it sums (Σ symbol - option "a"). Also select the total in the section lines. 9th Graph the results for such common sense does not in fact, because usually, as in this case, the results from the bottom of the table by several orders of magnitude smaller than those from the top. However, if you want to use a chart, you can even filter the resulting data. Let's call option using the filter columns: a / On the "Choices" select "Make a call - Call the filter column 'and fill out the form below (in the first list - Filter by column - select the last value): b / OK to confirm. Test the call looks like this (example): The values ​​but do not offer directly, since they are computed from the column. You must then enter them manually. If překlepnete, no data will be returned. c / The result looks like this: 10th So add some chart: 11thChart included in the composite view (Compound Layout) assembly and test by test challenges: Of course you could still use dynamically filled with the value of the best / worst results with a variable presentation, as indicated in the original example.





Experience with creating, using their own indicators and performance

In the next post I mention the experience with the creation, use and own performance indicators (calculated columns). Post article builds on two ways to define your own calculations (indicators) in the Business model .Custom indicator (eg, arithmetic operations on values ​​of two columns) can be defined in the following ways:


  1. Directly in the design report
  2. Using metadata using logical columns
  3. Using metadata using physical columns

1st In the draft report
  • Easy and quick setup
  • Suitable for use unfrequented indicators (the indicator is only available in the report where it is created)
  • The actual calculation is performed over the indicator aggregated or detailed (depending on whether the default indicator was preset in the metadata layer of an aggregate function)
  • When a misunderstanding of the indicators which are based computing and application functions may be incorrect / unwanted outcome (eg, averaged totaling no indicators or see. here )
  • I recommend using only if the source columns are also discussed in report
  • When using columns that are not content to report high physical question of COST, which can grow up to 6 orders of magnitude
  • This method of use for end users rather ad-hoc needs


2nd Using metadata using logical columns
  • The term can refer to columns / indicators in the logical table (from multiple sources)
  • First, aggregation is performed, and then calculate a new column which can affect the accuracy / inaccuracy of the results - see more. here
  • If the referenced column report content, so everything is OK. If not, then the question has a high physical COST
  • The indicator is named and delegated to the presentation layer - it can be reused

Sample final query: WITH sawith0 AS (SELECT DISTINCT t17101.is_on_us_flag AS c1, c2 AS t1339.date_dt l1_owner.d_date FROM t1339, t17101 l2_owner.a_stat_atm_agg WHERE (t1339.date_dt t17101.audit_id =)), sawith1 AS (SELECT SUM (t17101 . amt_amt) AS c1, c2 AS t1339.date_dt l1_owner.d_date FROM t1339, t17101 l2_owner.a_stat_atm_agg WHERE (t1339.date_dt = t17101.audit_id) GROUP BY t1339.date_dt) SELECT DISTINCT CASE WHEN sawith0.c2 IS NOT NULL THEN sawith0. c2 sawith1.c2 WHEN IS NOT NULL THEN sawith1.c2 END AS c1, CASEWHEN sawith0.c1 = '1 ' THEN sawith1.c1 ELSE 0 END AS C2 FROM sawith0 FULL OUTER JOIN ON sawith1 sawith0.c2 sawith1.c2 = ORDER BY c1 thirdUsing metadata using physical columns


  • The term can refer to columns in the tables attached individuals (source)
  • First, the calculation is performed, and the aggregation of a new column which can affect the accuracy / inaccuracy of the results - see more. here
  • "Slight" COST physical inquiry and whether or not the source columns used in the report
  • The indicator is named and delegated to the presentation layer - it can be reused

Sample final query: SELECT t1339.date_dt AS c1, SUM (CASE WHEN NOT LIKE '00% t5199.resp_code_cd ' t17101.trn_cnt THEN ELSE 0 END ) AS c2 FROM l1_owner.d_date t1339, t5199 lookup_owner.d_response_code,l2_owner.a_stat_atm_agg t17101 WHERE (t1339.date_dt = t17101.audit_idAND t5199.response_code_id = t17101.resp_cde_id t1339.date_dt GROUP BY ORDER BY c1 Conclusion From the above information, my recommendation is clear - to define their own indicators to use to the maximum extent of physical columns:


  • The indicator is delegated to the presentation layer, so it can be reused by end users themselves
  • There is another way of limited use (see final question)
  • Lower COST physical query

Business model is not necessarily a star

is true that the business model must be only in the shape of stars - can have the shape of flakes. The advantage of the model in the form of flakes is the automatic construction of hierarchies for dimensions including all levels and keys. The disadvantage is the complexity / complexity of the Business Model that contains multiple tables, columns, and links. How to do it 1 / structures will import data from database to the physical layer. Fill in the missing keys and links. Create a business model in which the physical layer-copy. 2 / When you mark a table that has a direct link with the facts from the table menu, select "Create Dimension ' 3 / result is an automatically generated hierarchy, including all levels of Erik Eckhardt.


SA System - automatic setting of user profiles

What is it?
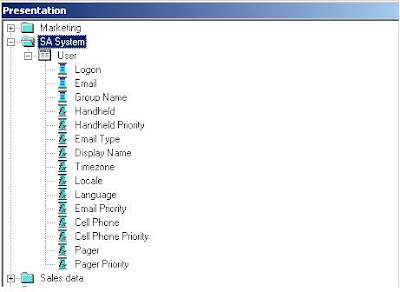
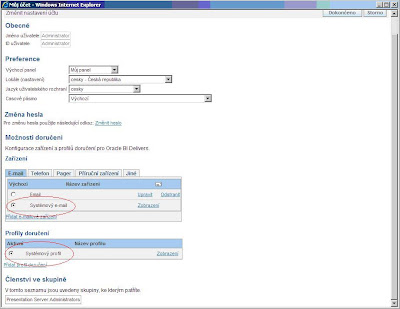
SA Presentation System is a system catalog, which can give basic information about the user (name, groups, contacts, ...) directly prezentačnímu server. This information can usefully be used for example in the component BI Delivers. Example of Using BI Delivers can send emails. Because the definition iBotu (BI Delivers process) are selected as recipients of the analytical system users, all users must assign an email address. This happens by default so that every user after logging into the system will create their own profile with email address in the "My Account". It is therefore a setting that does not have administrator control. Definition of system catalog "SA System" is the way to setting up user profiles to create and maintain bulk. How? Using the SA System catalog is very simple. It should create a presentation in metavrstvě catalog with a specific name and specific structure of the records .Presentation catalog is, of course, be derived from the Business Model, respectively. tables in the database. Here, the individual solutions may diverge, depending mainly on how it is resolved in the system of authorization and authentication. Usually, but start from a database table in which we hold the following information (for sending mail):


  • user name
  • e-mail address
  • email format (html / plain text)
  • priority email

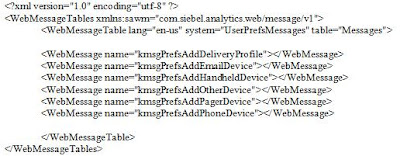
These columns should be prepared to link up to the presentation catalog to the corresponding columns. For other columns that do not use in our example is set by the Business Model initialization values ​​(konstatnty).Checking the result if everything is configured correctly in the "My Account" to each user profile, a new system and method of delivery (system e- mail system profile). Then you just make iBot, specify a list of recipients and the process will deliver a report or dashboard to our defined e-mail address. Tip at the end To have absolute control over user profiles, users should disable the option to add their own profiles and their activation. Variant 1) Setting the modes of delivery and profiles can be disabled in the menu - Administration - Manage privileges - My Account - Change Delivery Options. In this case, but the user can check system-requisites set profile - corresponding part in the "My Account" disappear. Option 2) You can only disable the display of the links in the Account Settings "Ad Delivery Profile" or "Ad Device". We achieve this by creating your own XML file, which suppress the default view of the required components: The XML file to save the $ ORACLE_BI \ web \ msgdb \ customMessages \ and restart the Oracle BI Presentation Server.


Function Ago () and error ORA-00942: table or view does not exist

Very standard act in BI is the construction of indicators forming the time series. For example, we defined indicator NUMBER. However, the user needs to see simultaneously in the same row of the table value of COUNT in the current month in the previous month ... to be 6 months back. The solution is simple - use the Ago () function Analytic Server, see instructions. here . In my case the business model arise new logical columns POCET01, POCET02, ..., POCET06 defined as: Logical column POCET01: AGO (BIFARM01.FAKTA_FNL.POCET, BIFARM01.CASDim.Měsíc, 1) logical column POCET02: AGO (BIFARM01.FAKTA_FNL.POCET, BIFARM01.CASDim.Měsíc , 2) ... The logical column POCET06: AGO (BIFARM01.FAKTA_FNL.POCET, BIFARM01.CASDim.Měsíc, 6) but I ran into a small snag. Newly created logical column I put into presentation catalog and began testing. I managed to create in BI Answers combination thus created only two logical columns. When I began to look progressively add the third, fourth, etc column, I got this error: ORA-00942: table or view does not exist. helped the following: In the physical layer The metadata repository is required at the source database rozkliknout Properties tab. And this check boxPERF_PREFER_INTERVAL_STITCH_JOIN , then save the repository and restart the BI Server. After that time a number of works without fault!


GROUP BY and BY clause

Example: If you need to create a report showing "n" best branches in individual years, then simply use the HEAT () or RANK () with the condition. Unfortunately, use the function itself is not enough! Report now shows the top 5 affiliates for the entire period, but we want the top 5 branches in each year. There are two solutions:


  1. Using the GROUP BY clause
  2. Using BY clause

1 / GROUP BY clause

on the "Advanced" explicitly specifies a GROUP BY clause, which when used with the "Display" function shall reset the values ​​for each group.When using the "Aggregate" function ensures the sum of values ​​for each group. The result is the desired report. 2 / BY clause is an alternative extension of the "Display" and "aggregation" function of "BY" clause. The result is the desired report. Erik Eckhardt .


Oracle BI - multiple instances on one server


Also, you have happened that you needed to have multiple running instances of Oracle BI and you did not have enough physical servers?You needed to have when developing applications in Oracle BI also have two different versions of the repository and the presentation catalog? It would be useful to take advantage of separate development and test server without having to install on another environment? Of course, the result can be achieved by splitting machines and virtualization of hardware resources available to us, two virtual servers. With a bit of skill but can get by with a single server operating system with a single installation of Oracle BI, which we can get a solution with two separate repository, presentation catalogs and URLs for user access. The principle of parallel run "two in one" achieved with a few basic properties Oracle Business Intelligence:


  • BI Server is able to load multiple repositories simultaneously (one BI Presentation Server, however, real-time access to only one).
  • The ODBC connection BI Server and BI Presentation Server you can define which repository to be used.
  • You can run multiple instances of BI Presentation Server on one machine with different parameters.
  • Applications can be deployed on application server several times under the rune names.
The architecture of such a solution is as follows: a BI Server repository with more loaded, two running instances of BI Presentation Server, each being connected to one repository. Each instance also corresponds to an independent application on the application server (OC4J, Tomcat, ...). How To I'll demonstrate using the Tomcat application server, but the method of solution is consistent with standard solution OC4J Container, which is part of the default installation of OBI. Retrieving two repository the BI Server, the first step is to edit a configuration file NQSConfig.ini in which the section [Repository] will add another record. The standard "Star = jmeno_repository.rpd, DEFAULT," add another line: "Star2 = jmeno_druhe_repository.rpd;." Important Two points:


  • one of the repository is marked as default,
  • Star, respectively. Star2 the internal logic repository indication that we will continue to work

Preparation of the second ODBC connection
while a standard ODBC connection to the BI Server called AnalyticsWeb automatically accesses the repository, which is labeled as DEFAULT, to make the second repository is necessary to create a second ODBC connection with a different name. The settings of this connection, enable the "change the default repository that" as the value and put Star2. Application Server is now necessary to create a second application "analytics" on the application server. BI Server in the directory "... \ OracleBI \ web \" is available analytics.war file, which for use on my Tomcat renamed (eg analytics2.war) and we will deploy new applications (to deploy to OC4J will use http:/ / localhost: 9704/em). After the successful deployment of the second application must modify the web.xml configuration file that is stored in the application server, WEB-INF. [tomcat: C: \ Program Files \ Tomcat 6.0 \ webapps \ analytics2 \ WEB-INF \ OC4J: C: \ oracle \ OracleBI \ oc4j_bi \ j2ee \ home \ applications \ analytics \ analytics2 \ WEB-INF \] In the web.xml file change the port number from 9710 to the 9712th The result of this step are two URLs, for example:http://localhost:8080/analytics http://localhost:8080/analytics2 Two instances of the presentation server The last step is to run two separate instances of BI Presentation Server so that each was associated with one applications and application server that was connected to various BI Server repository. To this end we make two copies of the configuration file InstanceConfig.xml that found in the directory ... \ OracleBIData \ web \ config \. New store a copy in the same directory and name instanceconfig_9710.xml andinstanceconfig_9712.xml . In the file instanceconfig_9712.xml then change:


  • DSN - name of the ODBC connection, pointing to non-default repository
  • Listener port - the new value of 9712
  • CatalogPath-catalog presentation to be used
Now we have everything ready for us to start two BI Presentation Server. Before this step, I recommend to restart the BI Server and Application Server. Individual instances run from the command line as follows: sawserver.exe-c C: \ OracleBIData \ web \ config \ instanceconfig_9710.xml sawserver.exe-c C: \ OracleBIData \ web \ config \ instanceconfig_9712.xml If everything is set correctly, are one computer independently disclosed two repositories, each with its own presentation catalog and the URL. If you do not like the presentation servers running in an open window, you can wrap up the classic service. I recommend the standard Windows tool RESKIT , more instructions can be found at: http://www.tacktech.com/display.cfm?ttid=197.


Limits PivotTable

EEC note: I have already described the setting in Article BI Answers - Tips / tricks with the PivotTable . Unfortunately, it is stated at the end, so it's easy to overlook - because once again and get:

Oracle BI enables reporting to a report in the form of contingency tables. Build a PivotTable is far easier than in Excel. For larger amounts of data, however, may easily happen that exceeds the "default" limits that are set for the pivot table after installing Oracle BI. default for PivotTable melting process than 20,000 lines and 150,000 display cells. For easy display the report in the form PivotTable modification is necessary in the configuration file ... \ OracleBIData \ web \ config \ instanceconfig.xml . A larger parameter values ​​by one to two orders:


  • CubeMaxRecords
  • CubeMaxPopulatedCell
  • MaxCells
However, you must reckon with the fact that it adequately with a number of processed data will increase the response time of processing such reports. Therefore, I recommend at the tables turn cashování.
Contents configuration file will be adjusted as follows:


Migrating from Oracle Discoverer to Oracle Business Intelligence EE / SE-1

If you want to switch from Oracle Discoverer to Oracle BI EE / SE-1, then there is no longer Migration Assistant, which ensures automatic transfer of metadata Discoverer (EUL) metadata for BI EE / SE-1 (RPD file). Migration Assistant (Discoverer Metadata Conversion Assistant) is a utility that you get to install OBI EE version 10.1.3.4. Migration Assistant on Exported EUL (*. EEX file) creates the OBI EE Repository (file *. EIA), including all layers - Physical, Business ( well as hierarchies for dimensions) and Presentation . After installation / upgrade OBI EE you will find it in this directory: ... \ OracleBI \ server \ Bin \ MigrateEUL.exe. At present it is possible to automatically migrate Discoverer metadata only itself. Reports and reports are now must be transferred manually.


  • For your idea of what migration entails and how it is to look at this video - Migrating Discoverer Video Store Tutorial on OBI EE . 
  • The document contains step-by-step process of the same (Migration Tutorial Video Store), including settings for the migration assistant can be found here .
  • Documentation and instructions on how to use the Migration Assistant can be found here .
  • Statement of Direction for Discoverer, see here .

Construction Link URL generated for assemblies with prompt

Recently a customer wanted me for whom I work, method of construction URL (published by GO URL that is described, but not quite perfectly, in document Oracle ® Business Intelligence Presentation Services Administration Guide, Chapter 11 Integrating Oracle BI Presentation Services into Corporate Environments Using HTTP). URL for Standard construction kits call (request) in the Obie - ie: http:// [


hostname]: [port] / analytics / saw.dll? Go & Path = [way to the assembly in the Web catalog] & NQUser = [Obie user] & NQPassword = [password]

Unfortunately, this URL displays the contents of the report directly without displaying the prompt, which is defined within an assembly (be careful not to be confused with a dashboard prompt) - so as to set the default prompt behavior, it is displayed in the dashboard for example: After a while experimenting with another design parameter of the URL (specifically, the Action parameter, which is described in the standard documentation in relation to other uses - for example, view a report in the "printer friendly" format, or call an assembly with passing parameters), I managed to attained the desired result.Construction URL to view the report with a defined prompt to display the first prompt (limit for entering the data in its own report) is as follows: http:// [hostname]: [port] / analytics / saw.dll? Go & Path = [path report in the Web catalog] & NQUser = [Obie user] & NQPassword = [password] & Action = Prompt

Navigating between reports with passing parameters between different areas, tables and columns

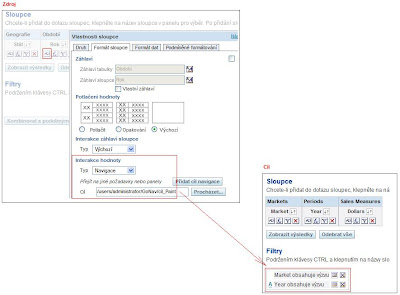
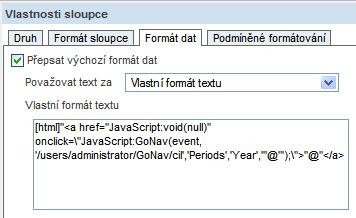
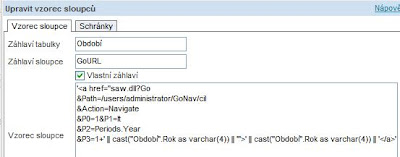
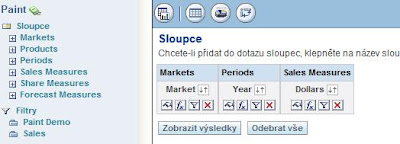
If you need to link multiple reports into one another with the functionality of the transmission parameters, the selected source column report set "Navigation" link to report the target to the selected column has a filter called "Contains a challenge." After the user clicks on a value in the source report is automatically redirected to the target report, with the target data according to a report filter out the source of values. Everything works perfectly if you work in a target area with the identically named tables and columns (or aliases), but what if you want to connect all reports from other areas tables and columns named differently? there are several solutions: 1 / JavaScript Gonave 2 / URL API GO 3 / Navigation + invitation + filter contains the query 4 / .... surely there are other options:) 1 / JavaScript Gonave JavaScript Gonave is part of the BI Presentation Services and its code is located in the viewhelper.js. Usage is quite simple, but as part of the code you write by hand and also know what to write - ie not for business users who prefer simple mouse clicks.The main disadvantage is that it allows Gonave to pass only one parameter! (of course, nothing prevents you from making you based on Gonave created a custom function that allows multiple parameters) a detailed description see the documentation for Oracle BI Presentation Services Administration Guide, Section Navigation Using JavaScript 215th page 2 / URL API Go Passing multiple parameters (currently up to version 6) addresses the reporting of GO URL API. Its advantages are its options, which is really a lot - for example, is used to integrate Oracle BI with external applications.The disadvantage is the relatively more than handwriting Gonave and greater complexity - again, not for business users. Detailed description, see the documentation for Oracle BI Presentation Services Administration Guide, Chapter Passing Filters to the Oracle BI Presentation Services Go URL Through a URL (Navigation) 212th Page 3 / Navigation + invitation + Filter contains the query I recently, along with Peter Podbraným come to the next option, which is much simpler than the previous ones (it is clicking the mouse) and of course supports passing multiple parameters. This option uses the standard navigation + filter "Includes invitation," plus a filter based on the results of another query. With this combination we are able to connect to any reports and pass them between the parameters of the different target areas, tables and columns. How to do it and what is the trick? In my case I have two reports:


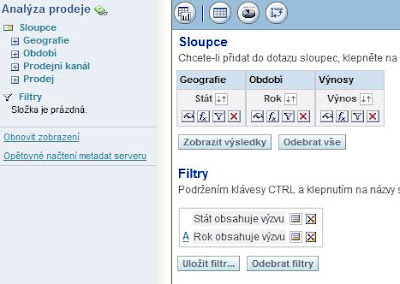
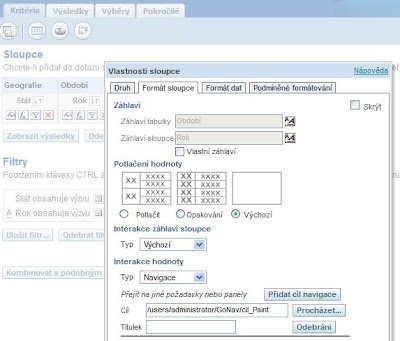
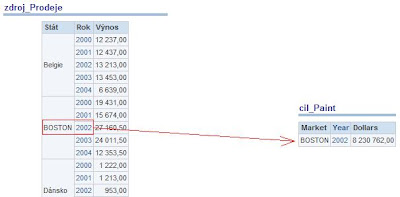
  1. Source report over the target area sales analysis (Czech metadata), columns Geografie.Stát, and Období.Rok Výnosy.Výnos
  2. Target report over the target area of ​​Paint (English metadata), columns Markets.Market, and Periods.Year SalesMeasures.Dollars
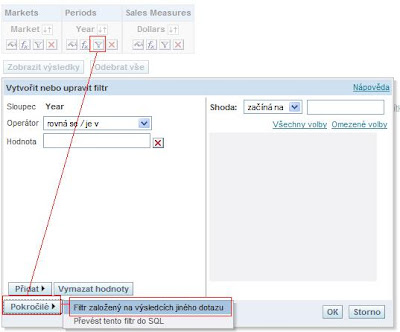
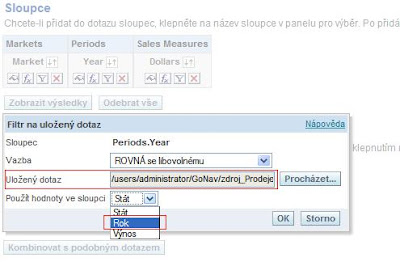
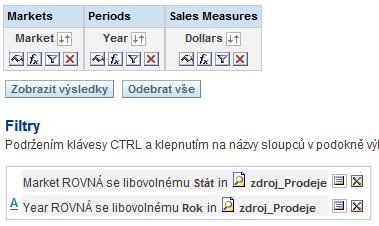
Functionality: When a user clicks on the source report on any column value Období.Rok will be automatically redirected to the target report - column value is passed to Období.Rok Periods.Year column, the column value is passed to Geografie.Stát Markets.Market column. 1 / Create the source and report to the columns through which to filter / pass parameters to set the filter "includes a call" - the first part of the tricks (in my case a column for the filter and are Geografie.Stát Období.Rok) 2nd Create a report of another target area (in my case over the area of Paint) third The target report add filter / s based on the results of another query (the source) - the second part of the tricks. Gradually add filters on all columns that have a limit (in my case, and Markets.Market Periods.Year). and / Filter creation b / filter settings - in the "Saved Query" to select a source and a report into the "Use values ​​in column "Select a column through which reports you want to bind (in my case Periods.Year = Období.Rok). c / as needed, add additional filters (in my case Markets.Market Geografie.Stát =) Note : lower disadvantage of this solution is that when the target run independently and report only contains information for a given condition - ie, only those rows that are identical to the source report! 4th Open the source report and a column through which will make navigation to navigate to the target report. The result is the interconnection of two reports with passing parameters between different areas, tables and columns: Erik Eckhardt.


Menu BI Dashboards

At first I thought it was a known thing that I mentioned here, but unfortunately the opposite is true. The default behavior of the BI Dashboard is that you next to "My panel" display all "Shared Panel". If you have a lot of them, it becomes a BI Dashboard confusing for users. For greater clarity, the individual can be thematically grouped into Dashboards separate groups which will be available from a simple menu. In my case, "Finance" are divided into:


  • Ledger
  • Receivables
  • Return
  • Commitments

How it works:

1 / For each group Dashboard Load in Web Catalog shared folder - in my case, Finance (folder name is seen in BI Dashboards). 2 / Individual (thematically similar) BI Dashboards to create the same shared folder 3 / The configuration file BI Presentation Services add DashboardMaxBeforeMenu parameter, ie the number of Dashboard, which can be displayed on the bar before it starts to create the menu.Erik Eckhardt.