Showing posts with label Answers. Show all posts

More OracleBI Answers Tips & Techniques

In this final posting in the series, I’ll be looking at three more tips and techniques for Oracle BI Suite Enterprise Edition.
The first one is around adding a column selector to a crosstab report. To take an example, on my dashboard there’s a crosstab (or pivot table, in Siebel Analytics-speak) that currently displays a number of measures by market segment and channel. It’d be nice if this same report would support analysis by a number of dimensions and channel, not just market segment,
To put this feature in place,  I go into Answers and add a new view – a “Column Selector” view.
Now, I can add any valid columns from the column selector and make them available, for substitution, instead of market segment.
Now, when I go back to the compound view, add this column selector view in and suitably alter the title, I can use the same report to analyze by any of these dimensions.
Now, using the same report, let’s say I want to alter it so that if the user clicks on any of the sales channel headers – Catalog, Direct or Internet – it launches into a new report using the Channel value as a parameter. The report I wish to link to is a bar chart showing units sold for that channel over time, like this:
However – here’s the good bit – I only want to display it for the channel that’s been clicked on. To do this, I add a filter to the channel column, and specify “Is Prompted” as the condition, so as to pick up the parameter passed across from the drill action.
Now, I go back to my original crosstab report, and edit the column properties for Channel, setting the value interaction to “Navigate”.
Then, I pick up the report to navigate to.
Now, when the user views the crosstab, the Channel values are hyperlinks…
which, when clicked on, bring up our barchart for that particular channel.
Finally, I want to add this new crosstab into my dashboard, but alter the default behavior of a dashboard element so that the crosstab drills in place, rather than launching out to a separate window – the barchart will always pop up, this is what I want – but I can drill and alter the crosstab in place within the dashboard. To do this, I add the crosstab as usual to my dashboard, but this time, select “Drill in Place” from the section properties, like this:
Now, when I drill into the hierarchies in this crosstab, the crosstab stays within the dashboard, only launching out when I request the bar chart report on channel sales.
As I said before, thanks again to Bas Roelands from Oracle Netherlands for passing on the techniques.

An Oracle Answers and Oracle Dashboard Walkthrough

If you read my article the other day on the architecture of OracleBI Suite
Enterprise Edition, here’s a walkthrough of creating a simple report and
dashboard. It’s using the Siebel version of the tools as the Oracle branded versions aren’t available yet on OTN, but the steps are the same regardless.
In this walkthrough, you are a sales manager looking to analyze the
performance of your organization. You want to see how well products are selling
by countries and regions, and understand how sales break down by marketing
manager and the product you sell. You would also like to see these results
graphically, and on a dashboard that comes up whenever you log in.
Before you start, your administrator has imported the

Global Sales Sample data
 into the physical layer of the Enterprise Semantic
Model, and then used this to build the business and presentation layers.
Now the data is ready, you start up Siebel Answers and select the Global
Electronics Sales Data subject area.
The first task is to produce a report of sales by country. You start this
process by selecting Warehouse and Units from the available items pane on the
left, which then adds the items to the columns area on the right-hand side of
the page. By clicking on the arrows icon next to the item name, you sort the
table from top to bottom using the units item.
Note that the right-hand side of the page has four tabs. The criteria tab
shows you the data items that are included in your report. The results tab shows
you a live view of the data, like this:
Whilst the Prompts tab allows you to define parameters, and the Advanced tab
exposes the logical SQL used by the query, together with it’s XML
representation.
Next you decide to add a graph to this table. You click on the pie chart icon
next to the Add View: control above the table, and are then presented with the
default graph view, a bar chart, for your data.
A graph is a type of “view” over your data, as is the table you created
earlier. The drop-down list under the right-hand tabs lets you select and create
various views over your query, and to finish the job off, you use the control to
select “Title” and give the report a title.
Finally, you select Compound Layout which displays the table and chart on the
same page.
You save the report before moving on to the second one.
You now wish to create a report with several perspectives on marketing
manager performance. To do this, you press the “Create a new request” button on
the top right-hand side of the page, and bring in marketing manager and units
sold. You do this with the Results tab open, and then add the product family,
noting that data gets added to the view as you go along, displaying the report
“live” as you add columns.
Notice how the Marketing Manager and Product Family items are in light blue -
this is because they are hyperlinks to lower levels of detail, and you can click
on them to drill-down to more detail.
To perform this drilling, Siebel Answers applies a filter to the results. To
see the filter, you click on the Criteria tab.
You remove the filter and go back to the original view.
Now you decide to turn the table of data into a crosstab. You click on the
View control and select “Pivot Table”.
Using the pivot table designer, you swap out product family for product
class, then place it on the Y axis of the pivot table.
Next, you format the Units items as currency.
And then you display the crosstab, with a pie chart next to it to show
proportion of overall contribution.
After saving this second one, you want to publish the two reports as a
dashboard. To do this, you click on the Dashboard link next to Answers at the
top of the page.
As this is your first dashboard, you are presented with the default, blank
page that invites you to add some content.
Af
After clicking on the link, you drag “Sales by Country” from the available
reports pane onto the dashboard.
You then save the dashboard and view it.
So far so good. Now you would like to add the Marketing Manager report; you
could add this report to the side of the one you’ve just added, or you could
place it under the existing one, but you’d like to add a second tab to the
dashboard and place it there. To do that, you click on the “Page Options”
control on the top right-hand corner of the dashboard, and select “Edit
Dashboard”, then press the button to add a new page.
Then you click on the “Dashboard Properties” button and rename the pages,
which become tabs on your dashboard.
Then, when you go back to view your dashboard, you’ve got two tabs, one for
sales reports, one for marketing manager reports.
Then, it’s a simple job to click on the marketing manager reports tab, and
add the second report to the dashboard. Make sure you select Pivot Table as the
view over your data, so that it shows the crosstab and the graph that you added.
Then, finally, you can view your dashboard.
So there you have it. That’s a very simple view of creating reports, graphs
and dashboards, and I’ve deliberately kept it as close to Discoverer and Portal
as possible, so that I can start to draw parallels and links between the two
sets of technologies. Going on from here, I’d go on to create Answers reports
that have multiple queries on the same page, and multiple views of the same
data, and then start delivering those reports as alerts when certain thresholds
are crossed. The dashboard product is a lot more sophisticated as well, and like
Portal, you can include external web content, other reports and links to other
applications as needed.
That’s it for me on Oracle BI Suite Enterprise Edition for a while. I’m
presenting on it at the

UKOUG BI & Analytics Event
 next week in London, so if you’re coming along,
say hello. This is the demo that I’ll be doing so if you come along, you’ll be
able to see it live.

Retrieving revenue average of last N months

An effective way of measuring any business process is to compare its performance during two periods of time. This comparison reveals the effectiveness of the decisions made during the second period. Therefore the results of that comparison are key to justify and support the decisions made.
This article describes the steps needed to build a dashboard showing the average order amount for the last months. The actual number of months will be chosen by the user when refreshing the dashboard.
This solution requires the following steps:
  1. Add new logical and presentation columns to the Oracle BI repository
  2. Create a dashboard prompt
  3. Create a request
  4. Embed the dashboard prompt and the request in a dashboard
Let’s take a closer look to each of them.
1. Add new logical and presentation columns to the Oracle BI repository
First of all we need to create a new logical column for each month for which we want to obtain the average. In this example, we want to get the average up to a year in the past, so we need to create 11 average month columns.
imagen 1
New logical columns need to be created
To do that, we need to create in the Business Model & Mapping layer a duplicate of the “Fact - Sales”.“Revenue” logical column for each month for which we want to get the average.
The new logical columns should be defined as calculations using logical columns (click on “Use existing logical columns as the source” in the General tab) and should have the following formula:
( AGO(Revenue Measure, Month, <Nº of months> - 1) +
AGO(Revenue Measure, Month, <Nº of months> - 2) +
… +
AGO(Revenue Measure, Month, 1) +
<Revenue selected month> )
/ <Nº of months>
Notice that the AGO part will be repeated depending on the number of months. Find next the formula to obtain the average for the last 6 months:
imagen 2
Formula for the calculated measure “Avg Revenue 6 Last Months”
Once all the new logical columns have been defined, we need to move them to the presentation layer:
imagen 3
New calculated measures need to be made available in the subject area
At this point, we can check that the new presentation columns are working properly and return the expected values. We can build a simple request as this one:
imagen 4
Checking the results of average revenue for the last months
2. Create a dashboard prompt
The users will choose the base month and number of last months for which to get the average based on their selection in a dashboard prompt.
Create a dashboard prompt with two columns: “Month” and “Number of months”.
“Month” will be chosen from a drop down list.
“Number of months” will be using the control “Edit Box” so that the users can type the number of months. We can choose the Year, for instance, to generate this column as it has a low cardinality, and will type in a label to avoid displaying the label “Year”. The default will be set in this case to 3 months. The property “Set Variable” needs to be set to “Presentation Variable” with the variable name set to “months”.
imagen 5
Prompt definition showing the setting of the Presentation Variable
The prompt will show like this:
imagen 6
Prompt preview
When the users type in a value in the prompt and click on the Go button, the variable “months” will be automatically set.
3. Create a request
Create a request with the required columns in the criteria tab. Then add a new column with the following formula:
CASE  @{months}{3} WHEN 1 THEN "Fact Sales".Revenue WHEN 2 THEN  "Fact Sales Month"."Avg Revenue 2 Last Month" WHEN 3 THEN "Fact Sales Month"."Avg Revenue 3 Last Month" WHEN 4 THEN "Fact Sales Month"."Avg Revenue 4 Last Month" WHEN 5 THEN   "Fact Sales Month"."Avg Revenue 5 Last Month" WHEN 6 … END
This column will always first check the value of the presentation variable “months” and, depending on its value (default is 3), will show the column corresponding to the required last number of months average.
Finally we need to create a filter specifying that the month is prompted. This will set the base month for the report.
imagen 7
Report criteria including columns and filters
4. Embed the dashboard prompt and the request in a dashboard
Add the new dashboard prompt and request into a dashboard page.
The users will be able to choose the base month and the number of months to be included in the average.
imagen 8
Report execution sample
When refreshing the report, it will retrieve data taking the value in “Month” in the dashboard prompt as the base month, and the value “Number of Months” as the number of months for which to calculate the average.

OBIEE Magic Trick !!!

Anybody ever face the typical enhancement requirements on existing dashboard reports about enabling the column sorting for all Tabular reports ? I’m sure ,definitely somebody have faced this . However ,I have faced this kind of new requirements from one of my recent client .
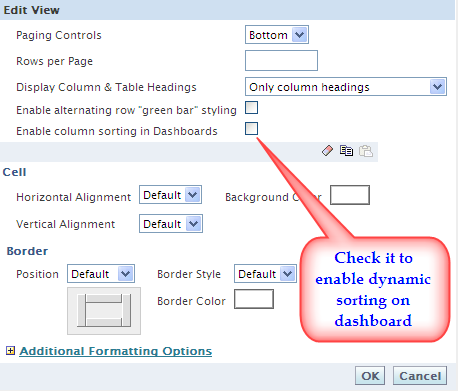
Dashboard Column Sorting
Think of , you have 500 reports already in place and it is very tedious job to hover across all reports individually and put a tick against the “Enable column sorting in dashboards” option .Though this is very simple and straightforward  however too irritating and hectic for developers as he/she has to modify each report and for doing this he/she need to click 7-8 times from editing till saving the request .So altogether you are saving 4000 click and overall a substantial minutes :) Don’t go for a Rapid Fire round !
So how it will be , if  we think of a tweak which will make developers free from this boring and hectic activities of monotonous job . Yes I know , some of you are thinking smartly to make a change on Stylesheet /msgdb XML templates or some tweak on instanceconfig.xml .
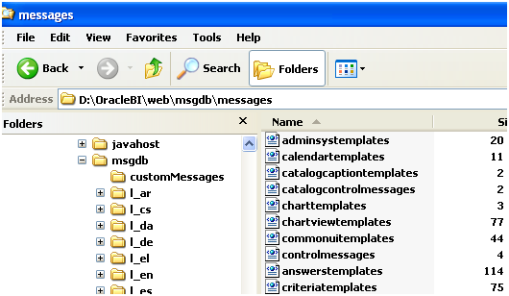
Fortunately I came to know that ,it could be achievable  from ” Global Sorting of Dashboard by changing XML ” i.e modifying answerstemplate.XML file from location \\OracleBI\Web\msgdb\messages .
Dashboard Column Sorting2
Only thing you have to do is ,search below strings from answerstemplate.XML file (before change)
<WebMessage name=”kuiCriteriaDefaultViewElements” translate=”no”>
Dashboard Column Sorting3And replace with below (after change) .
<WebMessage name=”kuiCriteriaDefaultViewElements” translate=”no”><HTML><view signature=”tableView” sortable=”true” /></HTML></WebMessage>
Dashboard Column Sorting4This has been well documented by Oracle .See this link . After doing it and restarting your services your reports should be automatically sorted and if you edit the request it would by default check the Sorting enable option .
Unfortunately this is not the end of story and that is why it is :
—————— xxxxxx A MAGIC THREAD  xxxxxx ——————-
I have implemented the above solution in my OBIEE 10.1.3.4 version and unfortunately  it doesn’t work good . So I have raised an ORACLE SR and it reveals that ,it is a product bug and hence I presume a Documentation bug .An Enhancement Request (ER) 6619910 has been currently with Oracle Support (P3/P4 Bug 6619910) to be considered for review by Development team for future bug fix release .
Alas ! what will be then about my 500 reports sorting in a moment ?? Yes ,there is way and don’t put your finger cross :)
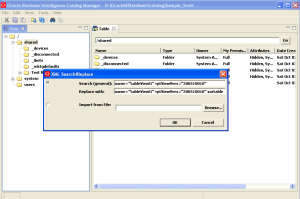
Open your Shared folders using Catalog Manager and do “XML Search and Replace ”  as below in offline mode :
Replace  name=”tableView!1″ rptViewVers=”200510010″ with
name=”tableView!1″ rptViewVers=”200510010″ sortable=”true” . Just restart Presentation Services .
Dashboard Column Sorting5
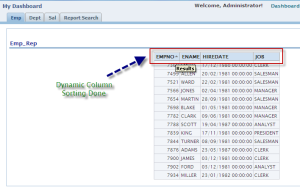
Voila …. It’s all magic see below ! Yes, all reports have been Sorted dynamically in dashboard within couple of seconds . Note that the above method is not documented and hence do it at your own risk .Suggestion is to keep the backup of catalog before performing the steps .
Dashboard Column Sorting6
Now , just think of how much effort you have saved to enable sort for your dashboard reports … Like a MAGIC  and less tricky so far!   :) :) :)