Showing posts with label level based measure. Show all posts

Oracle BI EE 10.1.3.4.1 – Do we need measures in a Fact Table?

I know this blog title can be classified as a deviation from my more conventional ones but i have been planning on writing this for a while now, so hopefully this should be of some interest to everyone. As we start working with BI EE more and more, we get to know what its good features are and along with it we get exposed to its not so good ones(as with any tool) more. Recently i came across a requirement where BI EE was being implemented on a Data Warehouse that was built almost 4 years ago. The Data Warehouse had been built based on Kimball’s model and it had been satisfying the requirements of the customer so far(excel & MSAS reporting) unless and until BI EE came in as potential replacement for MSAS. When the customer first told me this, i was kind of confused on why BI EE failed to meet their requirement considering the fact that it was a very simple data warehouse(standard set of dimensions and 3 to 4 fact tables). On further analysis, there were 2 main requirements that stood out to be showstoppers in using BI EE
1. Ability to use any dimension member(Across dimensions) as a measure and the ability to use any measure as a dimension attribute – This is one key requirement that cannot be solved easily by BI EE currently. The problem with Business Model and Mapping layer of BI EE is the fact that we have to identify measures. Though this will work in most cases but if we want to do true multi-dimensional reporting, then the tool should ideally provide us with an ability to even treat measures as dimensions. For example, consider the report shown below
Picture 18
This is a very simple report where Amount Sold and Quantity Sold are measures (both in the data warehouse as well as in BI EE). But what if the customer requirement is to create a report as shown below
Picture 19
In the above case, Amount Sold and Quantity Sold measures in the first report have become dimension attributes. Also, the Channel dimension attributes Direct and Indirect have become measures in the second report.
In my customer scenario, end-users required the ability to treat any dimension as measure and vice versa. So, clearly they wanted a multi-dimensional reporting capability using their existing Data Warehouse and using BI EE. In retrospect, i would say this is a very common requirement for users who are used to Multi-dimensional tools like Essbase, MSAS etc. In some cases, with BI EE 10g, where we need to treat dimensions as measures, we just use Pivot Tables. But in cases, where measures in BI EE need to be shown as dimension attributes, then the only way to solve such requirements is to use set operations like using UNION etc.If we use them in Answers, we will start facing all sorts of issues like losing drills, losing the ability to use is prompted filters etc. There are other methods as well like the one that i have discussed before here. But the problem is the fact that we cannot make any method (BI EE modeling methods)generic enough to solve all these requirements.
2. The second requirement was to provide drilling ability on measures. For example, consider the report below. Here the 2 measures Amount Sold and Quantity Sold have been grouped under SALES. Similarly there are another 2 measures, Unit Price and Unit Cost which have been grouped under COSTS.
Picture 20
Drilling on COSTS or SALES should give us the individual measures.
Picture 21
Picture 22
Though the above example demonstrates a single step Measure hierarchy, the actual requirement was to have a multi-level measure hierarchy.
Ideally, considering the requirement, this would have been solved by using Essbase & Smart View. But considering the fact that the customer had already bought BI EE, a solution was to be arrived at using BI EE 10g. There were 2 things that we knew & were sure of
1. The data warehouse was working well. The customer was open to tweaking it a bit further to enable this requirement within BI EE.
2. Essbase provides this capability and will quite easily solve the customer’s requirement.
We even thought of probably asking the customer to wait for BI EE 11g, but again the actual problem was in the fact that measures were actually required by BI EE which i don’t think will go away in the near future since the fundamental design of BI EE RPD revolved around the need to identify measures and dimensions(we weren’t sure of what changes in the RPD were coming in 11g and hence we had to find a solution in 10g itself). This is where we had to devise a DW model using the concepts of Essbase and then retrofit it back to the DW as well as BI EE.
I will illustrate what we did for the customer considering the SH schema of Oracle which is based on Kimball’s DW methodology.
Picture 23
As you see, we have 2 fact tables(of differing grain) and multiple dimension tables linking to the facts. Each fact table has a set of pre-defined measures as shown below
Picture 24
Picture 25
From an end-user perspective, each of the measures above are nothing but attributes of data. So, in effect if you model this in Essbase, what essbase will do is, it will maintain an internal single measure called (<Data>) and then everything else are nothing but attributes of this single measure(i.e dimensions. How these are internally stored within Essbase is determined by the 2 storage options BSO and ASO). So, to model this similar to Essbase, we start with separating out measures into its own dimension table called Measure as shown below
Picture 27
Then we create 2 new Materialized Views, Sales_Data & Costs_Data, on top the Sales and Costs fact tables as shown below
Picture 28
So the actual relationship diagram between the fact and dimension tables will look as shown below
Picture 29
So far so good. What this enables us is a fact that we can now sort of treat all measures as dimension attributes. But how do we now provide the ability to treat dimension attributes as measures.
This is done by applying Filter function on the DATA column. For example, to create a measure called Direct Sales we create a logical column and then apply a function as shown below
FILTER("SH - Multiple Measure Dimensions"."Sales - Facts".Sales
USING
"SH - Multiple Measure Dimensions".Channels."Channel Class" = 'Direct')
Picture 31
This way, we can create as many logical measure columns as possible depending on what we need to treat as measures in the presentation layer. The good part about this is, we can use an attribute as a measure and also as a dimension.
The idea is we build a model containing the following presentation layer
Picture 30
For every dimension table, there will be a corresponding Fact Measure table with measures required for reporting.
So, to achieve the first requirement where we need to convert the measures as dimension attributes, we choose the following columns in the report
Picture 32
Picture 19
If we look at the SQL of this report, you would notice that FILTER function converts it into relevant case when statements thereby providing us with the ability to do multi-dimensional analysis
select T14286.PROMO_NAME as c1,
     T14409.MEASURE as c2,
     sum(case  when T14224.CHANNEL_CLASS = 'Direct' then T14394.DATA end ) as c3,
     sum(case  when T14224.CHANNEL_CLASS = 'Indirect' then T14394.DATA end ) as c4,
     T14286.PROMO_ID as c5,
     T14409.MEASURE_ID as c6
from
     MEASURES T14409,
     PROMOTIONS T14286,
     CHANNELS T14224,
     SALES_DATA T14394
where  ( T14224.CHANNEL_ID = T14394.CHANNEL_ID and T14286.PROMO_ID = T14394.PROMO_ID
and T14394.MEASURE_ID = T14409.MEASURE_ID and (T14224.CHANNEL_CLASS in ('Direct', 'Indirect'))
and (T14409.MEASURE in ('Amount Sold', 'Quantity Sold', 'Unit Cost', 'Unit Price')) )
group by T14286.PROMO_ID, T14286.PROMO_NAME, T14409.MEASURE, T14409.MEASURE_ID
order by c1, c2
Similarly to solve the second requirement, we just need to pull the relevant measure attributes from the measure dimension and then use the DATA field for our measure
Picture 33
Picture 20
There are significant advantages of this method as this does not fix us to any specific dimension/measure. It provides an ability where we can swap measures and dimensions at will.
So the question to everyone reading this is, do we need measures at all in the Fact table(apart from the implicit Data Fact column)? Majority of the tools like BOBJ, Cognos etc all require measures to be assigned explicitly. How about forking out the measures into their own dimension and then treat everything else as normal? Are there any downsides to this approach? The features offered seem to outweigh the conventional modeling method. But i am aware that there could be potential problems with this as well. One problem which i could see is the performance. The size of the fact tables can grow quite quickly if there are a lot of measures. Also, the end-users might have to get used to this model. Is there anything else that you see could become potential problems in the future? If so, do put your thoughts in the comments section.

Oracle BI EE 10.1.3.4.1 – Level Based Measures & Grand Totals

One of the features that Oracle could add to BI EE, is in opening up the BI Server in the form of updatable APIs. Currently, the biggest stumbling block is if there are any lack of features we will have to completely depend on Oracle to add that feature. I thought Content Accelerator Framework or CAF that Oracle released as a free utility was a step in the right direction. It basically demonstrated how Catalog Manager can be extended to add more functionality. In fact, one can completely decompile the Catalog Manager jar files ourselves and add more features if needed. Unfortunately, in the case of BI Server, its not that straightforward. All functionality is hidden in the form of compiled DLLs or shared libraries. It is not possible to even use any standard de-compilers to understand how the queries are generated as the functionality is spread across multiple DLLs. Now only if Oracle could somehow expose a Framework within the Admin tool so that customers get an option to extend the BI Admin tool & its functionality, it will be all the more interesting.
Along similar lines(a feature that does not exist in the BI Server), I was asked recently how can we make Level based Measures to honor filters to attributes at lower levels. To expand further on the question, lets start with a very simple data model shown below
image
As you see, its a very simple model containing one dimension called Product and a set of Sales Measures. There is a Level Based measure called AMOUNT_SOLD_TOTAL which is assigned to the total level. Now, lets create a report containing Product Category, AMOUNT_SOLD and AMOUNT_SOLD_TOTAL.
image
This works as expected. Now, lets apply a filter to this report to show only product categories of certain products.
image
image
If you notice, the Level Based Measure assigned to the total level does not honor the report level filters. This is because the measure is applied to a level higher than the attribute that we are filtering on.  The Physical SQL fired is given below
WITH
SAWITH0 AS (select D1.c1 as c1,
     D1.c2 as c2,
     D1.c3 as c3
from
     (select sum(T8684.AMOUNT_SOLD) as c1,
               T8626.PROD_CATEGORY as c2,
               T8626.PROD_CATEGORY_ID as c3,
               ROW_NUMBER() OVER (PARTITION BY T8626.PROD_CATEGORY_ID ORDER BY T8626.PROD_CATEGORY_ID ASC) as c4
          from
               PRODUCTS T8626,
               SALES T8684
          where  ( T8626.PROD_ID = T8684.PROD_ID and (T8626.PROD_NAME in ('1.44MB External 3.5" Diskette', '64MB Memory Card', 'Bounce', 'CD-R Mini Discs', 'Internal 6X CD-ROM')) )
          group by T8626.PROD_CATEGORY, T8626.PROD_CATEGORY_ID
     ) D1
where  ( D1.c4 = 1 ) ),
SAWITH1 AS (select sum(T8684.AMOUNT_SOLD) as c1
from
     SALES T8684),
SAWITH2 AS (select D1.c1 as c1,
     D1.c2 as c2,
     D1.c3 as c3,
     D1.c4 as c4,
     D1.c5 as c5,
     D1.c6 as c6
from
     (select SAWITH0.c2 as c1,
               SAWITH1.c1 as c2,
               SAWITH0.c1 as c3,
               SAWITH1.c1 as c4,
               SAWITH0.c1 as c5,
               SAWITH0.c3 as c6,
               ROW_NUMBER() OVER (PARTITION BY SAWITH0.c2, SAWITH0.c3 ORDER BY SAWITH0.c2 ASC, SAWITH0.c3 ASC) as c7
          from
               SAWITH0,
               SAWITH1
     ) D1
where  ( D1.c7 = 1 ) )
select SAWITH2.c1 as c1,
     SAWITH2.c2 as c2,
     SAWITH2.c3 as c3,
     SAWITH2.c6 as c7,
     SAWITH2.c4 as c9,
     SAWITH2.c5 as c10
from
     SAWITH2
order by c1, c7
As you see in the SQL, the Product filter is not pushed into the second sub-query which calculates the level based measure. But what if we want a capability wherein we want the Level Based Measure to act like a Report Level Total i.e should honor the filters within the report for the same dimension as well. This is not possible out of the box. The behavior of Level Based Measures is completely determined by the BI Server and unfortunately we cannot customize that. This is an interesting use case. Though this report can easily be achieved using SUM BY clause directly from Answers, the question pertained to how we can achieve this using Level Based Measures.
So, to enable this(a workaround) we start with creating another logical table which will be an exact replica of the dimension that we created above
image
image
The only major difference is, we will not be assigning the measure to the total level of the new duplicate dimension. The duplicate dimension will refer to the same physical source. That is the key for this technique to work.
image
In the report, while applying the filter, use the column from the Duplicate Dimension. But the report will have columns from the Original Dimension. This will make the Level Based Measures to Honor the filters.
image
If you look at the Physical SQL now, you will notice that the filters are pushed even into the Level Based Measure Sub-query
WITH
SAWITH0 AS (select D1.c1 as c1,
     D1.c2 as c2,
     D1.c3 as c3,
     D1.c4 as c4,
     D1.c5 as c5
from
     (select sum(T8684.AMOUNT_SOLD) as c1,
               T8626.PROD_CATEGORY as c2,
               T8626.PROD_NAME as c3,
               T8626.PROD_CATEGORY_ID as c4,
               T8626.PROD_ID as c5,
               ROW_NUMBER() OVER (PARTITION BY T8626.PROD_ID ORDER BY T8626.PROD_ID ASC) as c6
          from
               PRODUCTS T8626,
               SALES T8684
          where  ( T8626.PROD_ID = T8684.PROD_ID and (T8626.PROD_NAME in ('1.44MB External 3.5" Diskette', '64MB Memory Card', 'Bounce', 'CD-R Mini Discs', 'Internal 6X CD-ROM')) )
          group by T8626.PROD_CATEGORY, T8626.PROD_CATEGORY_ID, T8626.PROD_ID, T8626.PROD_NAME
     ) D1
where  ( D1.c6 = 1 ) ),
SAWITH1 AS (select sum(T8684.AMOUNT_SOLD) as c1
from
     PRODUCTS T8626,
     SALES T8684
where  ( T8626.PROD_ID = T8684.PROD_ID and (T8626.PROD_NAME in ('1.44MB External 3.5" Diskette', '64MB Memory Card', 'Bounce', 'CD-R Mini Discs', 'Internal 6X CD-ROM')) ) ),
SAWITH2 AS (select D1.c1 as c1,
     D1.c2 as c2,
     D1.c3 as c3,
     D1.c4 as c4,
     D1.c5 as c5,
     D1.c6 as c6,
     D1.c7 as c7,
     D1.c8 as c8
from
     (select SAWITH0.c2 as c1,
               SAWITH0.c3 as c2,
               SAWITH1.c1 as c3,
               SAWITH0.c1 as c4,
               SAWITH1.c1 as c5,
               SAWITH0.c1 as c6,
               SAWITH0.c4 as c7,
               SAWITH0.c5 as c8,
               ROW_NUMBER() OVER (PARTITION BY SAWITH0.c2, SAWITH0.c3, SAWITH0.c4, SAWITH0.c5 ORDER BY SAWITH0.c2 ASC, SAWITH0.c3 ASC, SAWITH0.c4 ASC, SAWITH0.c5 ASC) as c9
          from
               SAWITH0,
               SAWITH1
     ) D1
where  ( D1.c9 = 1 ) )
select SAWITH2.c1 as c1,
     SAWITH2.c2 as c2,
     SAWITH2.c3 as c3,
     SAWITH2.c4 as c4,
     SAWITH2.c7 as c9,
     SAWITH2.c8 as c10,
     SAWITH2.c5 as c12,
     SAWITH2.c6 as c13
from
     SAWITH2
order by c1, c9, c10, c2
Not a straight forward solution but can be used if the only filters that you apply in your reports are through prompts. Remember the drill filters will not be honored as well (as the drills will automatically apply filters using the columns from the original dimension). This behavior can potentially change in future releases.
Anyway, Happy new year everyone. Wishing everyone success in this new year ahead!!!

Oracle BI EE 10.1.3.3/2 – Level Based Measures from Answers – Using Advanced Logical SQL

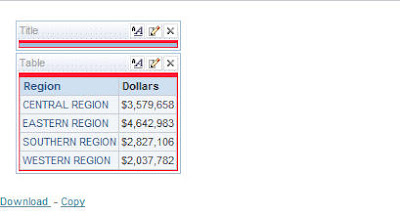
I was on an interesting customer call yesterday wherein the customer wanted to know whether BI EE can solve one of their reporting problems. Let us first try to understand their problem by a simple example. Look at the screenshot below.
      
As you see, the above picture shows a simple report of Sales By All the Regions in US. Now the customer wanted to have another column in this report which should be a summation of all Sales in all the Regions which in turn should be independent of the filter applied on the report i.e. even if we have a filter in the above report to show ‘EASTERN REGION’ and ‘CENTRAL REGION’ alone, the third column should show all Sales in all the Regions (without applying filter on this SUM). This can be easily achieved by using Level Based Measures. But the problem with this approach is that it has to be setup in the repository which the customer did not like. His argument was there are so many measures in his organization and it is not simply feasible to create LBM’s across all the levels. He basically wanted a workaround by which the above feature can be directly obtained from the UI instead of modifying the repository. Unfortunately, there is no out of the box way to achieve this directly in answers. There are 2 approaches to solve this
1.   using EVALUATE and then call a database function
2.   Using Advanced Logical SQL.
We have the seen the option 1 quite a few times before. Hence i will not be discussing that here. Instead lets look at the 2nd option. One of the major advantages of BI Server is that one can fire logical SQL’s directly. The logical SQL would basically fire the query to the BI Server and then the BI Server would convert the query to database specific queries. So, basically when you create any report, you can see the Logical SQL getting created in the Advanced Tab of the report.
      
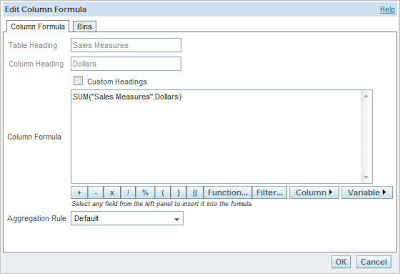
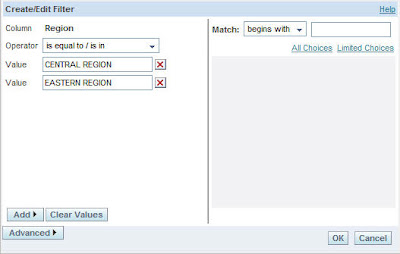
This logical SQL follows ANSI standards. Now, lets add a filter to the above report (1st screenshot) to display only CENTRAL AND EASTERN REGIONs. Also, add another column as SUM(Dollars).
      
      
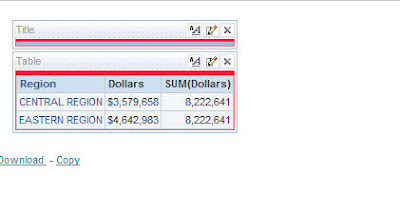
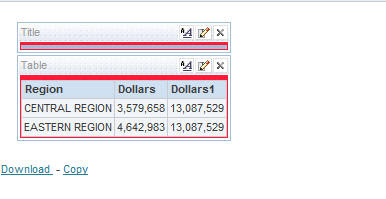
Now, lets look at the results.
      
As you see, the 3rd column does a summation of Sales only for the Regions within the filter. So, the summation is being done after the filter has been applied. In order to achieve our desired results, go to the Advanced tab and look at the SQL. THE SQL would look like the one shown below
SELECT Markets.Region saw_0, “Sales Measures”.Dollars saw_1, SUM(“Sales Measures”.Dollars) saw_2 FROM Paint WHERE Markets.Region IN (‘CENTRAL REGION’, ‘EASTERN REGION’) ORDER BY saw_0
Now, change this SQL to the one shown below
SELECT A.Region saw_0, A.Dollars saw_1, A.Dollars1 saw_2 FROM (SELECT Markets.Region , “Sales Measures”.Dollars, SUM(“Sales Measures”.Dollars) as Dollars1 FROM Paint) A WHERE A.Region IN (‘CENTRAL REGION’, ‘EASTERN REGION’) ORDER BY saw_0
Click on Set SQL. Now, if you go back to the results tab, now you should see the Summation of Sales for all the Regions in the 3rd column even after applying the filter.
      
You can also use advanced SQL clauses like the one shown below
SELECT A.Region saw_0, B.Dollars saw_1, A.Dollars saw_2 FROM (
SELECT
Markets.Region,
SUM(Measures.Dollars) as Dollars
FROM Paint
) A LEFT OUTER JOIN (
SELECT
Markets.Region,
“Sales Measures”.Dollars
FROM Paint
) B ON A.Region = B.Region WHERE A.Region IN (‘CENTRAL REGION’,'EASTERN REGION’) ORDER BY saw_0
The above would be pretty useful if you want to make joins across subject areas. But the main disadvantage with the above approach is that you would lose your normal drilling capability.