Another pretty interesting question came up the other day on one of our internal forums. A small variation of the question goes like this
” I have a tabular view of a report in a dashboard. I also have a chart view of a different report in the same dashboard but in a different section. So, if i click on a metric say Year 2003 on the tabular view then the graph in the another section alone(not other reports) should filter for the year 2003″
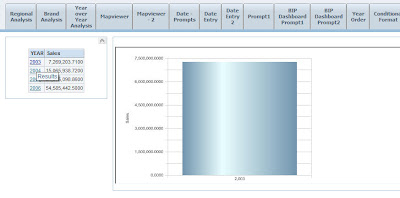
We will be seeing how to go about the achieving the above by creating 2 simple reports. Lets start with a simple report containing 2 columns. Year and Sales.
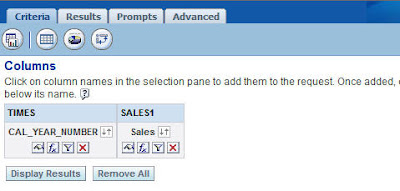
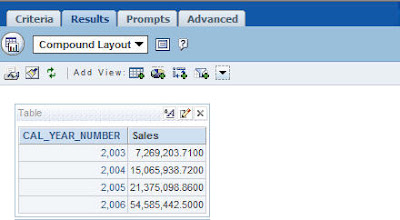
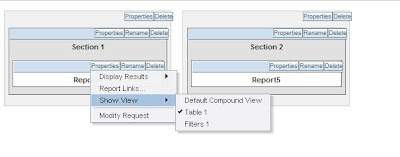
Create a tabular view for the above report. I have saved this report as Report4.
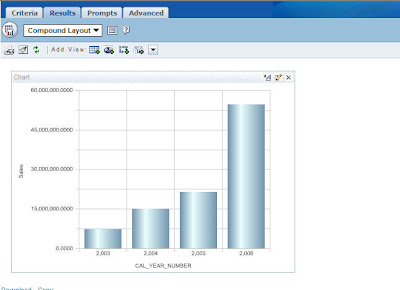
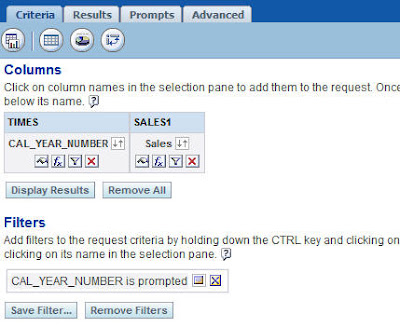
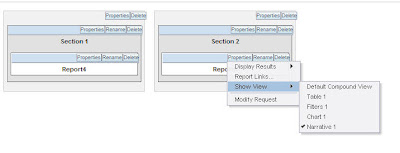
Now lets create another report with the same columns Year and Sales (for simplicity sake iam using the same columns. You can create any other report). But in this case lets create a chart view instead of a tabular view. Also create a filter on Report5 on year column with “is prompted” clause. Save this report as Report5.
Our aim is, when i click on any year in the tabular report(report4) then the corresponding chart view in Report5 should vary.
Now go back to the older report and go to the Column properties of the Year Column and in the Data Format tab change the data format to Custom Text and enter the following
[html] <a href= http://localhost:9704/analytics/saw.dll?GO&path=/shared/paint+demo/script+test/report5&Action=Navigate&P0=1&P1=eq&P2=TIMES.CAL_YEAR_NUMBER&P3=@ target=”biee2″>@</a>
What we have basically done is we have made the column to be of HTML format. Each and every column value is made to behave like a dynamic GO URL using the href tag. The href would basically point to the second report (report5) that we have created and will also pass the year value via “@” symbol. Do note the target value biee2. This is what we will use to point to a particular section. Save this report again.
Now go back to the second chart report and create a narrative view. In the narrative view enter the following
<IFRAME src=http://localhost:9704/analytics/saw.dll?GO&Path=/shared/Paint+Demo/script+test/Report5 name=”biee2″ height=”300″ width=”200%”></IFRAME>
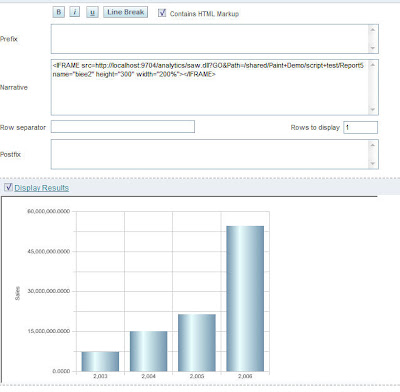
Do note the name(biee2) of the iframe that we have used above. It is the same as the target that we gave in the first report (Report4). This iframe basically points to itself (the compound layout will have the chart view and hence this will show the chart view. Ensure that you are not including the narrative view in the compound layout. Also, enable the HTML markup and restrict the number of rows to one.
Now go back to a new dashboard page and include the tabular view of the first report(Report4) and the narrative view of the second report(Report5) in the dashboard.
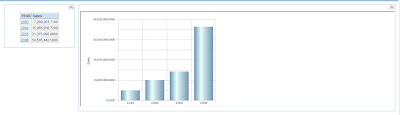
Now if we click on say Year 2003 the chart within the iframe alone will modify based on what we have clicked. Very simple but can be useful at times in a lot of situations.
This can also be achieved using Dashboard Navigation but in that case all the reports will be run again once and will also filter all the other views.

