While i was away on vacation, a set of pretty good questions came up as comments in the Contact Me page of this blog. Though i never expected this page to get any comments at all, it looks like i was wrong. So, apologies to everyone who have been waiting for a reply from my end. I plan to make a reply as soon as a comment is made from now on. Among those comments, one user had a question on how to go about creating a dashboard prompt to list down specific report names and while selecting the report names the user wanted to show those corresponding reports within the dashboard. I have had this question asked before. Though it is not pretty straight forward to achieve this, lets look at one of the possible approaches today. In order to do this, lets start with a very simple example. You can modify this to suit your needs. In our example, our aim is to make the dashboard prompt to show two report names ‘Brand Sales’ and ‘Region Sales’. Based on what we select in this dashboard prompt we would be showing either the Brand Sales Report or the Region Sales report in the dashboard. Lets start with creating the dashboard prompt. For now we shall be hardcoding the values in the dashboard prompt.
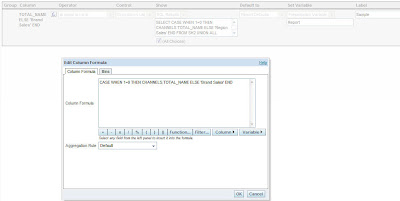
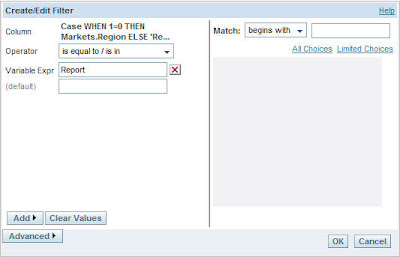
So, create a dashboard prompt on a column (though this column will not be actually used. This is just to trick the BI Server) and in the formula enter the below case statement.
CASE WHEN 1=0 THEN CHANNELS.TOTAL_NAME ELSE ‘Brand Sales’ END
As you see the idea is not to filter on the actual column but instead on a dummy value of Brand Sales.
Once this is done, go to the Show drop down and go to SQL Results. In the SQL Results enter the below SQL. Also, make the prompt to set a presentation variable say Report
SELECT CASE WHEN 1=0 THEN CHANNELS.TOTAL_NAME ELSE ‘Region Sales’ END FROM SH2 UNION ALL SELECT CASE WHEN 1=0 THEN CHANNELS.TOTAL_NAME ELSE ‘Brand Sales’ END FROM SH2
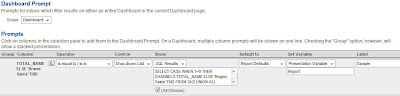
As you see above, what we are basically doing is making the dashboard prompt to print our Report Names and then we are making the presentation variable to accept these report name values. Now the next step is to create 2 reports that each will return rows for one of the above selections and zero rows for the other selection so that we can use this as a source for our guided navigation section.
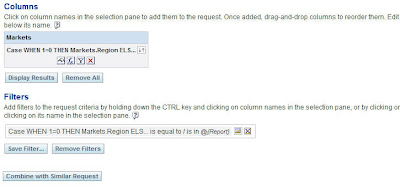
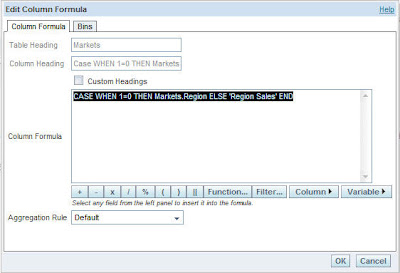
What we are basically doing above is creating a report that just has a column with a dummy valueRegion Sales. And a filter is applied on this report with the presentation variable Report so that this report will return non-zero rows when we choose Region Sales value in the dashboard prompt. Similarly this report will return zero rows if we choose Brand Sales value in the dashboard prompt. Create another report as shown above but in this case make it to return non-zero rows when Brand Sales is chosen.
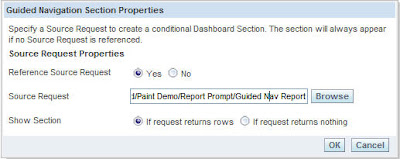
Now go to the dashboard and include the dashboard prompt that we created in a normal section. Now included 2 other sections below this dashboard prompt and each of these sections would be a guided navigation section. Include the region sales report in GN section and Brand Sales report in the other GN section. Go to the GN section properties containing the Region Sales Report and in the source, reference the report that we created above and make it to show only when it returns some rows. Similarly, for the GN section containing the brand sales report, reference the second report that we created above and make it to show only when it returns non-zero rows.
Now go to the dashboard and include the dashboard prompt that we created in a normal section. Now included 2 other sections below this dashboard prompt and each of these sections would be a guided navigation section. Include the region sales report in GN section and Brand Sales report in the other GN section. Go to the GN section properties containing the Region Sales Report and in the source, reference the report that we created above and make it to show only when it returns some rows. Similarly, for the GN section containing the brand sales report, reference the second report that we created above and make it to show only when it returns non-zero rows.
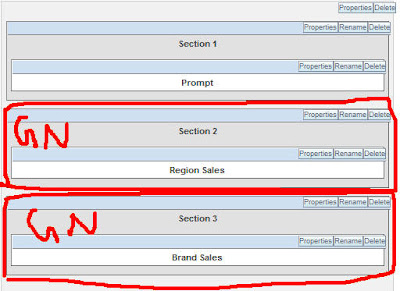
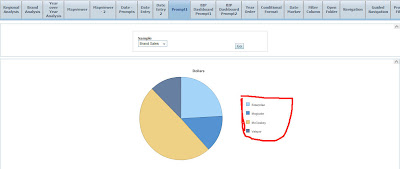
Now if you go choose Brand Sales in the Dashboard prompt, you would see that the Brand Sales report would be listed. Similarly if you choose Region Sales, then the Region Sales report would be shown.
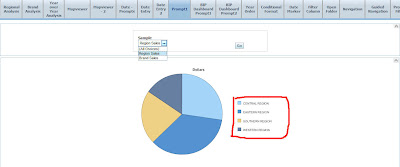
The idea is pretty straight-forward. But this can be used especially if you want to allow your users to choose multiple reports.

