I was on an interesting customer call yesterday wherein the customer wanted to know whether BI EE can solve one of their reporting problems. Let us first try to understand their problem by a simple example. Look at the screenshot below.

As you see, the above picture shows a simple report of Sales By All the Regions in US. Now the customer wanted to have another column in this report which should be a summation of all Sales in all the Regions which in turn should be independent of the filter applied on the report i.e. even if we have a filter in the above report to show ‘EASTERN REGION’ and ‘CENTRAL REGION’ alone, the third column should show all Sales in all the Regions (without applying filter on this SUM). This can be easily achieved by using Level Based Measures. But the problem with this approach is that it has to be setup in the repository which the customer did not like. His argument was there are so many measures in his organization and it is not simply feasible to create LBM’s across all the levels. He basically wanted a workaround by which the above feature can be directly obtained from the UI instead of modifying the repository. Unfortunately, there is no out of the box way to achieve this directly in answers. There are 2 approaches to solve this
1. using EVALUATE and then call a database function
2. Using Advanced Logical SQL.
We have the seen the option 1 quite a few times before. Hence i will not be discussing that here. Instead lets look at the 2nd option. One of the major advantages of BI Server is that one can fire logical SQL’s directly. The logical SQL would basically fire the query to the BI Server and then the BI Server would convert the query to database specific queries. So, basically when you create any report, you can see the Logical SQL getting created in the Advanced Tab of the report.
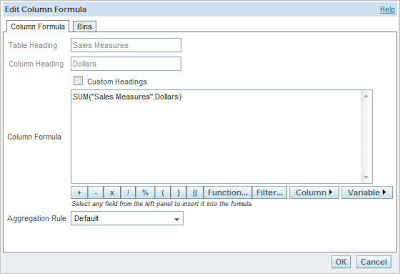
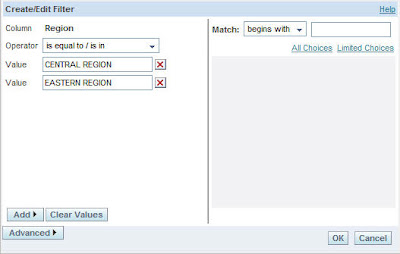
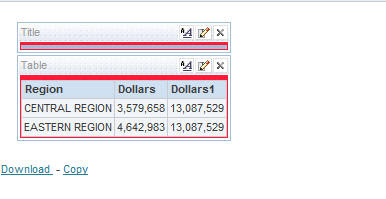
This logical SQL follows ANSI standards. Now, lets add a filter to the above report (1st screenshot) to display only CENTRAL AND EASTERN REGIONs. Also, add another column as SUM(Dollars).
Now, lets look at the results.
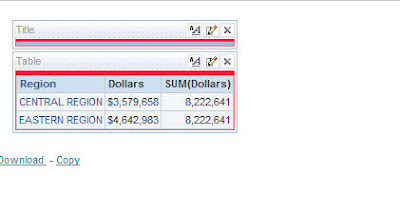
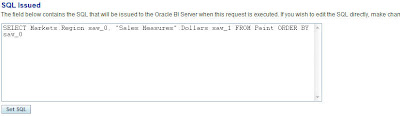
As you see, the 3rd column does a summation of Sales only for the Regions within the filter. So, the summation is being done after the filter has been applied. In order to achieve our desired results, go to the Advanced tab and look at the SQL. THE SQL would look like the one shown below
SELECT Markets.Region saw_0, “Sales Measures”.Dollars saw_1, SUM(“Sales Measures”.Dollars) saw_2 FROM Paint WHERE Markets.Region IN (‘CENTRAL REGION’, ‘EASTERN REGION’) ORDER BY saw_0
Now, change this SQL to the one shown below
SELECT A.Region saw_0, A.Dollars saw_1, A.Dollars1 saw_2 FROM (SELECT Markets.Region , “Sales Measures”.Dollars, SUM(“Sales Measures”.Dollars) as Dollars1 FROM Paint) A WHERE A.Region IN (‘CENTRAL REGION’, ‘EASTERN REGION’) ORDER BY saw_0
Click on Set SQL. Now, if you go back to the results tab, now you should see the Summation of Sales for all the Regions in the 3rd column even after applying the filter.
You can also use advanced SQL clauses like the one shown below
SELECT A.Region saw_0, B.Dollars saw_1, A.Dollars saw_2 FROM (
SELECT
Markets.Region,
SUM(Measures.Dollars) as Dollars
FROM Paint
) A LEFT OUTER JOIN (
SELECT
Markets.Region,
“Sales Measures”.Dollars
FROM Paint
) B ON A.Region = B.Region WHERE A.Region IN (‘CENTRAL REGION’,'EASTERN REGION’) ORDER BY saw_0
The above would be pretty useful if you want to make joins across subject areas. But the main disadvantage with the above approach is that you would lose your normal drilling capability.

