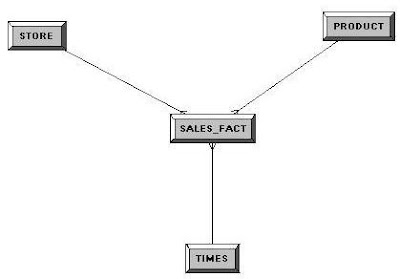
In connection with the OBI often talk about interactivity, support for standards, open solutions. That's not just empty slogans to try to prove in the next post. What is it? users will appreciate the analytical possibilities of expansion while maintaining indoor comfort interactive dashboard. For examining the data geographically can provide analysts with an interactive map where you are zaintegrovány information from OBI. To do this, we display the map on the dashboard and interwoven it with other content do not need to be a programmer to integrate complex and expensively purchased geographical software. Simply use the opportunities that the Internet gives us. Why should solve something if one solves for us? portal, for instance atlas.cz or Google Maps (see example of use of BI in practice) provides on its website an interactive map, which is also available open APIs, which can affect the map. This allows us to directly from the dashboard display the desired section of the map in appropriate detail, in addition to marking the selected city.Additional information about sales in the city can get in a bubble. It is indeed part of the map, but due to the fact that a particular report in the OBI can be made via a URL, I can provide full display properly filtered reports on the city. Preparatory work assumes that the presentation layer we have the facts to the linked table geographical dimensions. In my case it consists of Czech and Slovak table cities (id and name) assigned to each region and state. This dimension must be defined for our purposes to extend the stack into which we put GPS GPS coordinates for each city (the URL encoder modified, eg byhttp://www.opinionatedgeek.com/DotNet/Tools/ UrlEncode / Encode.aspx ). They will use later to call the desired map. A new column is obviously necessary to propagate through the physical and business model to the presentation catalog. facts table in addition to the geographic dimension dimensioned by time (year, month, day) and by product (product category, product). They are stored in it indicators of Revenues, Cost, Profit and sold units. In order to use APIs for maps on Atlas.cz, you need to register athttp://amapy.atlas.cz/api/registration.aspx . There is also studying the documentation "Amapá API", especially the use of examples. It should also be enabled using HTML and JavaScript within BI reports and dashboards, instructions can be found here . A little JavaScript before moving on to create reports, you need to prepare helper HTML page, through which we communicate with the Atlas maps. You must place the Web server directory, in my case it is Tomcat directory (c: \ Program Files \ Tomcat 6.0 \ webapps \ analytics \), otherwise mostly bundled directory server to OBI ($ BI_HOME \ oc4j_bi \ j2ee \ home \ applications \ analytics \ analytics \). The central part of the whole process is the code of the HTML page that the header "HEAD" API call contains JavaScript functions that specify the map, in the body "Body" then the definition of the size of the "DIV", in which the map appears. On this page we will then refer the OBI, along with the parameters to API functions convey information about which city to be designated.
First, you need to call in the header link to JavaScript: After using the documentation and examples for JavaScript API might look like this:italics marked MAXURL parameter value in the code defines a URL link to the report, to be displayed within the map in a bubble. Competent report we have created so far, adding value we can leave for later. At the very body of the HTML document we have to do is call:
Preparing ReportsNow we have everything ready for us to start work in the Answers. To demonstrate the solution we need three reports:


- Navigation report - a simple list of cities that use the map settings.
- Map - a report that provides the actual map display.
- Internal report - a report that appears in a bubble within the map.
Navigation report is a common face of cities, which are classified into visibility regions. Later, when we have prepared dashboardovou site here will add more navigational link. View the map itself will provide a special report in which we will use display type
Narrative . The selection will be included columns Town, GPS and ID_mesta and add a filter to one of the cities. He serves as the default setting (in this case I do not recommend to use a filter like "Is prompted" / "contains a call"). The compound show will put a single strand Narrative (Description) and his body put the following HTML code: Where to place


 localhost: 8080 add your own name and port of the server. This ensures view previously prepared site as part of the report. At the same time pass parameters via URL variables @ číslo_sloupce , using API functions which are passed on information about which city should be shown.
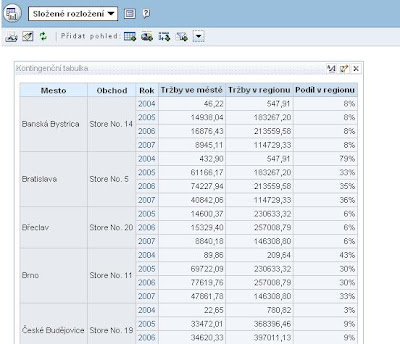
 The third step is a report that appears in a bubble within the map. In it the user to submit detailed information about the selected city. In my case, I came to town ranked several indicators linked to the time dimension (year). The filter will be included as a numeric column ID_mesta 'Is prompted ", to be used for parameter passing.
 Report adjust to the desired view.
After saving, we can go back to editing HTML pages with JavaScript and add to the value of the parameter MAXURL correct path to this report.http://localhost:8080/analytics/saw.dll?GO&Path=/shared/
/& Action = Navigate & P0 = 1 & P1 = eq & P2 = & P3 Obchody.ID_mesta = '+ id_mesta
the P2 argument is specified table name and column (presentation), according to which the filters, to give the value of P3 id_mesta JavaScript variable. More about the report or dashboard view using the URL, see the administrator documentation prezentačnímu server (Presentation Services Administration Guide) in the chapter Integrating Oracle BI Presentation Services into Corporate Environments Using HTTP . Dashboard Creation and revision of the result now we have just put together all the components ready for a dashboard. For our purposes, let's create a special dashboard, or at least a separate page. On the one hand it will put a report navigation, and its report with the map.
 After saving the dashboard will come back to edit the navigation report, where in the properties column set the navigation City values. As a target we choose just created dashboardovou page.
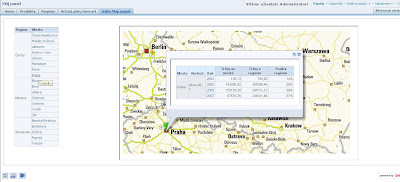
 Recap - Functional solution according to the method described, it should look like this:
In the navigation on the dashboard report, click on one of the cities. The report responds to the event map, which marks the selected city. The bubble within the map that shows the selected city, after maximizing display detailed report on a specific city. And more detail:
- Click on a specific city in the Navigation Report can call the page again, which we display. Click on a filter but will respond in the report with a map (which is not protected) and sets the selected city.
- Report with map assigns the selected city ID_mesta and GPS coordinates. These values are transmitted as URL parameters external HTML page that we prepared at the beginning.
- This page is capable in its JavaScript code supplied parameters used both for the specific API call function on Atlas.cz maps and also to build the URL to display the report in a bubble by a URL.
Post created and sent
James Genz - BI / DW Consultant Sophia Solutions.
thanks James!


