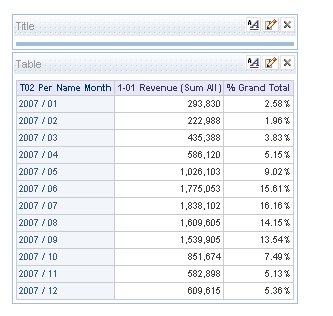
Calculating grand total column or % of grand total is easy in pivot table view. But how can I create the same in a table view? Well in table view you can create a grand total row with the table view options! But, that is not what we want. We want it so that you either have grand total as a column or % grand total. To do this I will be using sample sales to demonstrate.
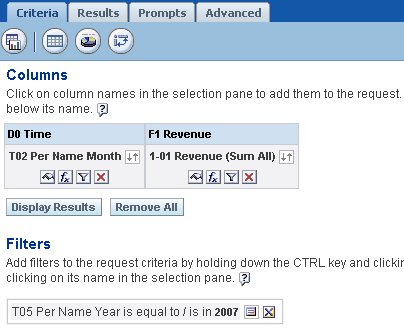
First we create the base report. This base report will have the Month column and the monthly revenue.
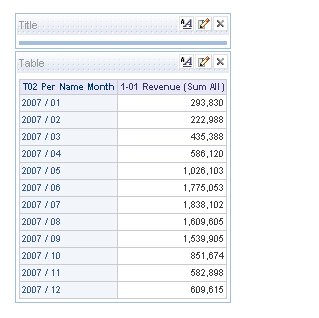
The result of this base report is:
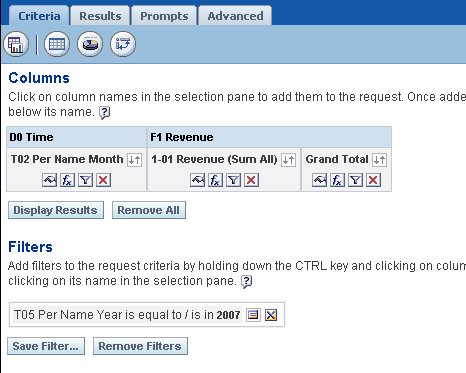
Now we want to include the grand total as a column for each row. To do this we create a new column called grand total.
With expression:
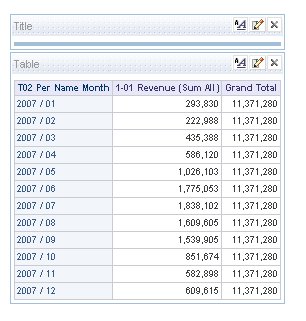
See what we did! We wrote the expression formula to sum() the metric. This metric is already defined in the metadata or BMM layer as a metric with aggregation rule of sum. So by wrapping or using this metric within a sum() within the report, we are telling the BI Server we want the sum of the aggregated sum(s) or pretty much the Grand total. Here are the results:
Now let’s say we do not want to show the Grand Total column per row but the actual % of Grand Total. Here we change the Grand Total columns column heading and expression:
Note: We also needed to change the column properties Data Format to properly show the data in the correct format.
Here are the results.
So there is how you create a “Grand Total” or “% grand total” in table view.
