Yesterday we saw how to dynamically vary the columns in a report based on the column that we choose in a dashboard prompt. But if you had noticed, the column header in that report would have had a constant value. I got this question yesterday via email, whether there is any way we can make this column header dynamic. Well, today we shall see how to go about achieving dynamic column headers. Actually if you go to table or column headings in a table view you would notice that it accepts only static text. One cannot enter presentation variables and make it to convert them to their actual values. So, in order to achieve the dynamic column headers, we start with the same report from where we left off yesterday here. The idea is very straight forward. It consists of the following steps
1. Hide the actual Column and Table Headers.
2. Cast all the columns to CHAR.
3. Decide on the name for your static column headers.
4. Create conditional formatting on the all the columns and make them to display in a specific color whenever data matches the Column Header Names.
5. Add a new criteria and combine it with the older one using UNION ALL. The columns in this criteria would contain the Actual Column Header values that you want (dynamic).
6. Make these values to display at the top of the report.
I know it might be a bit confusing why we are doing certain operations above. We shall go through each of the above in detail. Lets take the same dynamic report that we created yesterday.
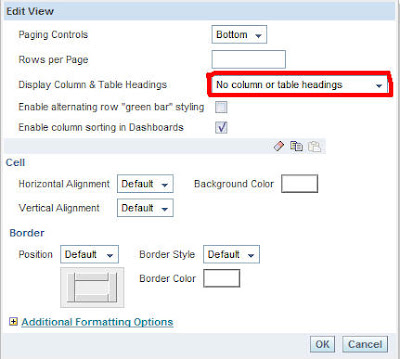
1. Go to the table view properties and hide the actual column and table headers. We are doing this because our plan is to use a data element from the table itself(which we shall generate later using UNION ALL) as the column header instead of the actual column headers.
2. Cast all the numeric columns to char since we would be appending non-numeric column headers which would come from another data set. Now decide on a column header name for all the columns that you have in your report. For example, in our report, one column header name would be dynamic (which would come from the presentation variable @{Geography} and the other Column header would SALES

3. Once you have the column header names decided, now add conditional formatting to all the columns in the report to something like this i.e. whenever SALES1.SALES = ‘SALES’ (the static column header name that we decided earlier) then add a background color of light green. In my case. i have added the below conditional formatting to both the columns.

4. Now that we have added the conditional formatting, next is we need to add the criteria that will add our necessary column header values to the report data. So, use UNION all to combine the new criteria with the older one.
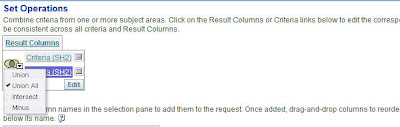
Add some dummy columns and in the formula enter the column header values. In my case ‘{@Geography}’ and ‘SALES’. Ensure that you include atleast one column in the formula as shown below.


5. The last step is to make the new data that we added to display at the top of the report. So, now add 1 new column to both the criteria and enter 2 in formula tab for the one containing the data and 1 in the formula tab for the one containing the column header values. Sort the results on this column.


6. Now save this report. And go to the dashboard. You would have dynamic column headers.


I know the above procedure is too tedious for achieving a very small functionality. But again, if your users absolutely need it and you dont have any other options just use this approach. Just remember this works only for table views.

