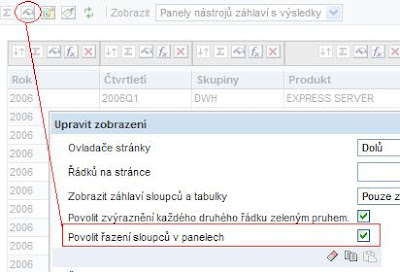
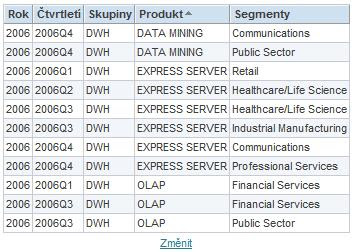
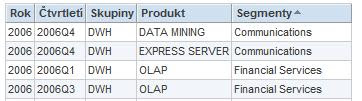
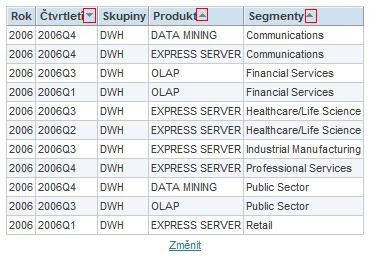
Probably most of you can set up an interactive sorting columns in a table published in the Dashboard. When you turn on "Allow sorting of columns in the panels' reports and vypublikování the Dashboard, users can begin to sort the data interactively in a table - just click the mouse on the column heading. But what if users will need to sort data by multiple columns? Until now, all I said, it unfortunately is not (and I was not alone). Clicking on another column in the table eliminates the previous settings and data are ordered only by the new column. If you wanted the user to sort data by multiple columns, so he had to open the report in BI Answers. Yesterday , after three years of sales and consulting to Oracle BI (exSiebel BI), I accidentally discovered that even on Dashboadu can interactively sort data by multiple columns.Maybe it's mentioned somewhere in the documentation or described on another blog, but I never noticed it, and even colleagues in the business know it. How did I come? I made a report, I set him sort by three columns and vypublikoval the Dashboard - and there I noticed that the table header sorting is specified for each column. I thought, if it can display, so it must go and set up. And as for example in Windows Explorer to select multiple values at once, or a specific value? Sure, it's using the Shift and Ctrl . Therefore, if you want to sort the data on the Dashboard by multiple columns, hold down the Ctrl key, click on the column and then Ctrl release . That's all:)Erik Eckhardt.