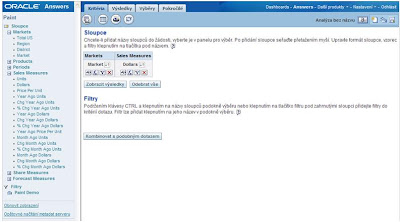
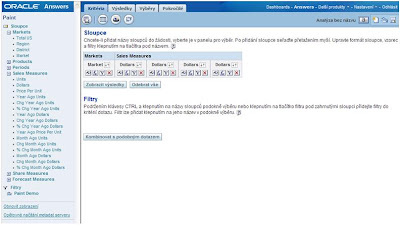
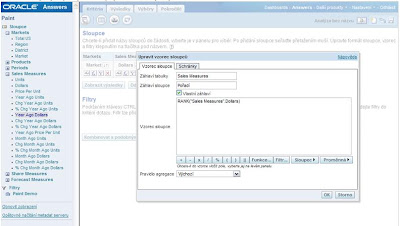
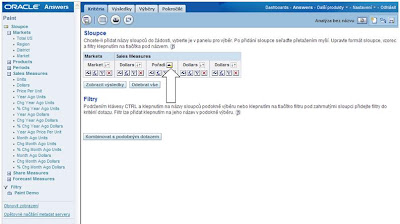
On the last training, I demonstrated an example of the customer list and Top N Other . Fell question whether it was in the same assembly simultaneously write "N" best and "N" worst. Below you will find a solution by the demonstration by "Paint": 1st Select One column with the dimensions and facts a second The same facts have to add a column 33rd His second appearance edit (Edit column) 4th On the same column set sort 5th Next column will be used to determine which of the lines are among the "Top 5" and the "Worst 5". Choose again, "Edit Column" (fx button) and use the following CASE statement: CASE WHEN RANK ("Sales Measures". Dollars) <= 5 THEN WHEN Markets.Market RANK ("Sales Measures". Dollars)> MAX (RANK (" Sales Measures ". Dollars)) -5 Markets.Market THEN ELSE 'Other' END In this modified column will display the names of branches (dimension values) in the event that one of the first or the last 5. Otherwise, this column "Other" 6th The last column will serve as an aggregation group "Top 5", "Worst 5" and "Other". Click again on the "Edit columns" and apply the following formula: CASE WHEN Rank ("Sales Measures". Dollars) <= 5 THEN 'Top 5' WHEN Rank ("Sales Measures". Dollars)> MAX (RANK ("Sales Measures" . Dollars)) -5 THEN 'worst 5' ELSE 'Other' END This now looks like a list of columns in the selection criteria: 7th Now switch to PivotTable. Exclude column and Market Order (original dimensions). In the column, leaving only the rates of Dollars (facts table) and the Group column and place the branches to the section lines: 8th Column group to hide and make it sums (Σ symbol - option "a"). Also select the total in the section lines. 9th Graph the results for such common sense does not in fact, because usually, as in this case, the results from the bottom of the table by several orders of magnitude smaller than those from the top. However, if you want to use a chart, you can even filter the resulting data. Let's call option using the filter columns: a / On the "Choices" select "Make a call - Call the filter column 'and fill out the form below (in the first list - Filter by column - select the last value): b / OK to confirm. Test the call looks like this (example): The values but do not offer directly, since they are computed from the column. You must then enter them manually. If překlepnete, no data will be returned. c / The result looks like this: 10th So add some chart: 11thChart included in the composite view (Compound Layout) assembly and test by test challenges: Of course you could still use dynamically filled with the value of the best / worst results with a variable presentation, as indicated in the original example.