One of the users of BI EE had sent me an email yesterday asking about the various options for improving performance of reports in BI EE. There are lots of options available in BI EE to improve the performance of reports in general. One of the widely used ones is the use of Aggregate Tables. So, lets try to understand what are Aggregate tables and how they can be used. As the name suggests, Aggregate tables are Physical tables that store Aggregates of measures across multiple levels of a Hierarchy. So, for example, say if you have the following hierarchy

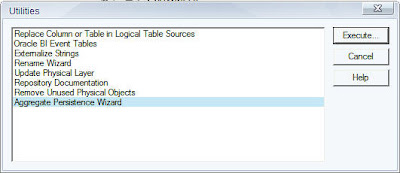
and say you are analyzing Sales Measure across this hierarchy, you can store the aggregated values of this measure across all the above levels so that the BI Server can use this aggregate table instead of querying against the transactional database. Now, lets see how to go about creating Aggregates. There are 2 ways of doing this. One way is to manually create an Aggregate table and then associate that table with the dimension levels. The other way (recommended one) is to use the Aggregate Persistence Wizard available within BI EE. So, if you go to the Admin Tool -> Utilties you would find a utility called as the Aggregate Persistence Wizard.
The first step in using this wizard is to specify an output file name for the resultant script. This script is what we will execute later to create the Aggregate tables and their corresponding mapping to the various levels of the hierarchy

The next step in creating the Aggregate script is to specify the measures for which you would like to create the aggregate tables. Remember, you can only use those measures that have some predefined aggregation set.

Once that is done, choose the levels across the dimensions which you would like to associate with the aggregation. In our case we shall choose the lowest country level.

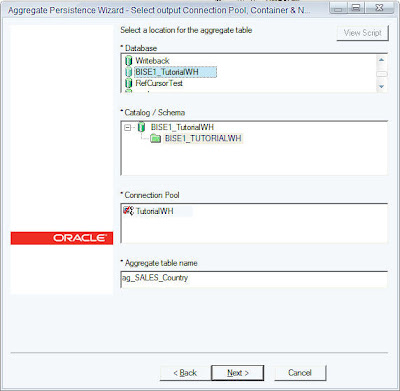
Once the levels are chosen, choose the names and the connection pool for the target aggregate table.
Then complete the wizard. This would create the script in the output directory you specified.

If you open the script you would see some UDML based commands that can be recognized only by the BI Server. So, lets see how we can go about executing them. Go to command prompt and navigate to {OracleBI}/Server/Bin and there you would find an executable called as nqcmd.exe. This is what we will use to execute the above script. Use the command below to execute this
nqcmd -d AnalyticsWeb -u Administrator -p Administrator -s “D:\AggregateCountry.sql” -o “D:\Outputfile1.txt”

Once this script is executed open the Admin tool and the repository. If you navigate to the connection pool you would find the aggregate tables created.

Also, if you double click on any of the levels above the Country level (say SubRegion_Name), you would find that the logical mapping has been automatically created by the script.

Before proceeding further lets just go back to the database and see how the data of the aggregate table looks like. Remember, there will be 2 tables. One is for storing the level hierarchy and the other is for storing the aggregates.

And, at last lets create a simple report in BI Answers containing the Region, SubRegion and Country Columns. After that look at the query that is fired in the backend. You would notice that the aggregate table will be used instead of the actual transaction table.


